Many types of human tissue—such as the brain and spinal cord of the central nervous system, the peripheral nervous system, and muscles, including the heart muscle—are fibrous in nature. Isotropic human models that assume homogeneous volumes for every individual tissue do not properly take this into account.
Computational Models of Human Tissue Compartments
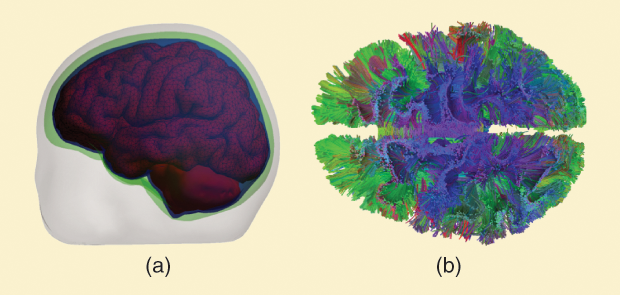
Today, the most commonly used human brain tissue geometries employed in electromagnetic (as well as biomechanical, thermal, and acoustic) finite-element method (FEM) and boundary-element method (BEM) computations are built on a surface-based description of otherwise isotropic brain tissues, as shown in Figure 1(a). Isotropic material properties inside the compartments follow established databases. A voxel-based volumetric description is another alternative. Several software tools exist for obtaining the surfaces from magnetic resonance imaging (MRI) data such as the Massachusetts General Hospital (MGH)/ Harvard Medical School’s FreeSurfer and the Oxford Centre’s Functional MRI of the Brain Software Library (commonly called FSL). These tools have also been combined into automated processing pipelines such as SIMNIBS (the Max Planck Institute for Biological Cybernetics’s Simulation of Noninvasive Brain Stimulation software), facilitating the generation of models at the individual subject level. While these approaches provide sufficient detail for many important applications, they do not directly reflect the complex underlying geometry of the fibrous tissue or the electromagnetic response of bundles of nerve fiber (tracts) shown in Figure 1(b).
Mapping the Geometry of Fibrous Tissue Noninvasively
Approximately 20–30 years ago, medical research constructing a physically realistic model of human brain connectivity in vivo began with the mapping of neural fiber pathways in white matter. The most commonly used methods are based on diffusion MRI (dMRI). To sensitize MRI images to diffusion, a magnetic pulse with a spatial gradient is applied along a number of different directions. Another gradient pulse of the same magnitude but an opposite polarity is subsequently applied to refocus the proton spins. This refocusing will not be perfect for protons that have moved during the time interval between the pulses (typically, tens of milliseconds) due to water diffusion; consequently, the signal intensity in the MRI data is reduced. Hence, the resulting image shows low signal intensity in regions where diffusion along the applied diffusion gradient is high.
This diffusion anisotropy is due to the restricted mobility of water molecules in the axons themselves and in the interaxonal space between fibers: diffusion is more impeded perpendicularly to the fibers. Using this information, we can draw a “fiber orientation” at a point of interest in the direction of the largest diffusivity. By selecting a seed point and forming a streamline following the predominant fiber directions, we can reconstruct a fiber connectivity map (or connectome), as shown in Figure 1(b), where different colors indicate different fiber directions.
To utilize the rich structure obtained from the dMRI tractography reconstructions, we propose that the fiber network could potentially be used to replace the white matter shell as well as other fibrous tissues. However, there are some fundamental challenges in achieving this. First, we should note that the representation of the fiber geometry obtained by dMRI tractography is not unique due to the inherent inverse problem associated with reconstructing the “global” fibers based on the “local” principal fiber directions.
Second, the number of fibers in the reconstruction may be on the order of 100,000, potentially creating a heavy computational load. However, the number of fibers used to represent the brain is largely a user-defined property, as the streamlines are generated computationally and the number of fibers per volume has no direct physical interpretation (for more on the interpretation of dMRI tractography, see [1]).
Despite these challenges, the key advantage of this method is that it can produce geometrically accurate representations of the very complex major white matter bundles completely noninvasively, so that individual subject-level fiber models are readily obtained.
The Tensor Approach Versus Orientation Distribution Functions
![Figure 2: The front views of the fiber tracts reconstructed from dMRI data with different b-values. Streamlines passing by either of the bilateral postcentral gyri were selected and shown here. For different b-values, the same region in the centrum semiovale is boxed in yellow and magnified to reveal the differences. Reproduced from [4] with permission.](https://www.embs.org/wp-content/uploads/2017/07/makarov02-2701490.png)
The most straightforward characterization of tissue anisotropy is MRI-based diffusion tensor imaging (DTI). The electric conductivity and permittivity tensors may be obtained by assuming some cross-property relationships between these and the DT. Such macroscopic modeling is under active investigation by several research groups, including a recent multimodal- imaging-based, highly detailed anatomical model of the human head from the Swiss Federal Institute of Technology. However, the basic tensor model assumes a locally uniform fiber ensemble. Although a very well established and highly useful technique, DTI is not capable of accurately capturing more complex fiber geometries such as fiber crossings. For example, if one fiber points vertically and another fiber points horizontally, then the DT will resemble a disk.
With the development of MRI scanner hardware and pulse sequences, as well as analytical methods, orientation distribution function (ODF)-based approaches can be used to resolve intravoxel fiber crossings with increasing spatial and angular resolution. Using the MGH-University of Southern California Siemens 3T Connectome scanner equipped with a 300-mT/m gradient system [2], the diffusion weighting b-value in the MRI data can be drastically increased while maintaining a sufficiently high signal-to-noise ratio. With increasing b-value [measured in units of inverse diffusion coefficient (s/mm²)], only the signal from the most restricted water remains, which in turn results in sharpening of the ODFs and improved delineation of the fiber crossings [3]. The improved local characterization of the principal directions of the crossing fibers then potentially results in more accurate tractographic reconstructions in the regions with multiple fiber crossings, as demonstrated in Figure 2 [4].
Fibers as Thin-Wire Antennas?
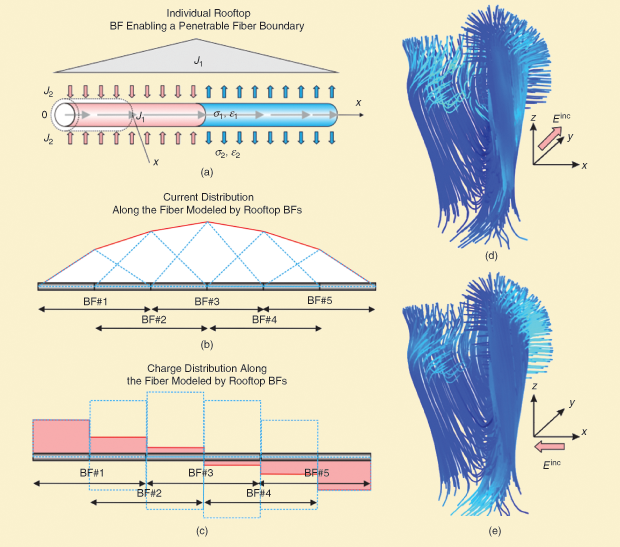
A seemingly quite unrelated discipline—antenna theory—routinely operates with many interacting thin wires of different diameters arbitrarily distributed and oriented in space with an arbitrary topology of joints. The Numerical Electromagnetic Code for wire antennas was developed at Lawrence Livermore National Laboratory and then used by many antenna researchers. We propose that it should be possible to adapt this method to thin-fiber modeling in the biomedical domain, using essentially the same “rooftop” basis functions shown in Figure 3(a)–(c).
However, the thin-wire method will need modifications because the brain fiber may sink or source electric current through its walls/terminations [5]. After implementing these necessary modifications, our preliminary results suggest that the method appears to be quite fast yet accurate when compared to the “exact” FEM simulations. The largest fiber model computed so far involves tracts in the left hemisphere hand-motor area. The model includes approximately 700 individual tracts having some 100 segments each [6]. The entire bundle was embedded into a low-conducting medium. Figure 3(d) and (e) illustrates the total current distribution in individual fibers at different directions of an incident electric field (with strength of 100 V/m). The fiber diameter was chosen to be 10 µm; fiber conductivity is 4 S/m (embedded into a 0.5-S/m surrounding medium).
Potential Applications
![Figure 4: The optimized coil position to stimulate an axonal bundle. Shown are (a) the target range of interest (ROI), (b) the tractography results in the ROI, (c) the computed optimal coil location (see [6]), and (d) the e-field gradients.](https://www.embs.org/wp-content/uploads/2017/07/makarov04-2701490.png)
There are many potential practical applications that could utilize this fiber-based approach, including computational targeting of transcranial magnetic stimulation (TMS) [6]. In our previous work, the fibers were assumed to be immersed in a homogeneous volume conductor (brain), and only their geometric shape was used in estimating the strength of the TMS-induced effective electric-field (e-field) gradients along the tracts. With the fiber-based approach, we could also incorporate the geometry of the fibers explicitly into the volume conductor model, thus potentially improving the computational e-field estimation (Figure 4).
For brain-related applications, our overarching goal is to develop the fiber-based approach to enable large-scale modeling of the anisotropic tissue compartments, such as human cerebral gray and white matter. As a prerequisite, accurate tractographic reconstructions of the fiber bundles both in the deep white matter and near the gray–white matter boundary are needed. A step toward this has been recently taken by utilizing multiple b-value multiresolution data to obtain accurate fiber reconstructions both in gray and white matter regions [7]. The proposed fiber model is a simple, highly conducting cylinder with two types of electric current: a larger axial current and a smaller transversal current through cylinder walls. This model is, in principle, expandable to include a nonlinear effect of the membrane potential in the transversal direction and diffusion dynamics in the axial direction.
Acknowledgment
Research reported in this article was supported by the National Institutes of Health under award numbers R00EB015445, R01MH111829, U01MH093765, P41EB015896, S10RR023401, and S10RR023043. The content is solely the responsibility of the authors and does not necessarily represent the official views of the National Institutes of Health.
References
- D. K. Jones, T. R. Knösche, and R. Turner, “White matter integrity, fiber count, and other fallacies: The do’s and don’ts of diffusion MRI,” NeuroImage, vol. 73, pp. 239–254, July 2013.
- K. Setsompop, R. Kimmlingen, E. Eberlein, T. Witzel, J. Cohen-Adad, J. A. McNab, B. Keil, M. D. Tisdall, P. Hoecht, P. Dietz, S. F. Cauley, V. Tountcheva, V. Matschl, V. H. Lenz, K. Heberlein, A. Potthast, H. Thein, J. Van Horn, A. Toga, F. Schmitt, D. Lehne, B. R. Rosen, V. Wedeen, and L. L. Wald, “Pushing the limits of in vivo diffusion MRI for the Human Connectome Project,” NeuroImage, vol. 80, pp. 220–233, Oct. 2013.
- Q. Fan, A. Nummenmaa, T. Witzel, R. Zanzonico, B. Keil, S. Cauley, J. R. Polimeni, D. Tisdall, K. R. Van Dijk, R. L. Buckner, V. J. Wedeen, B. R. Rosen, and L. L. Wald, “Investigating the capability to resolve complex white matter structures with high b-value diffusion magnetic resonance imaging on the MGH-USC Connectom scanner,” Brain Connectivity, vol. 4, pp. 718–726, Nov. 2014.
- Q. Fan, T. Witzel, A. Nummenmaa, K. R. A. Van Dijk, J. D. Van Horn, M. K. Drews, L. H. Somerville, M. A. Sheridan, R. M. Santillana, J. Snyder, T. Hedden, E. E. Shaw, M. O. Hollinshead, V. Renvall, R. Zanzonico, B. Keil, S. Cauley, J. R. Polimeni, D. Tisdall, R. L. Buckner, V. J. Wedeen, L. L. Wald, A. W. Toga, and B. R. Rosen, “MGH-USC Human Connectome Project datasets with ultra-high b-value diffusion MRI,” NeuroImage, vol. 124, pp. 1108–1114, Feb. 2016.
- S. N. Makarov, A. Pascual-Leone, and A. Nummenmaa, “Modeling fiber-like conductivity structures via the boundary element method using thin-wire approximation. I Construction of basis functions,” in Proc. 38th Annu. Int. Conf. IEEE Engineering in Medicine and Biology Society, Orlando, FL, Aug. 2016, pp. 6473–6476.
- A. Nummenmaa, J. A. McNab, P. Savadjiev, Y. Okada, M. S. Hämäläinen, R. Wang, L. L. Wald, A. Pascual-Leone, V. J. Wedeen, and T. Raij, “Targeting of white matter tracts with transcranial magnetic stimulation,” Brain Stimulation, vol. 7, pp. 80–84, Feb. 2014.
- Q. Fan, A. Nummenmaa, J. R. Polimeni, T. Witzel, S. Y. Huang, V. J. Wedeen, B. R. Rosen, and L. L. Wald, “High b-value and high Resolution Integrated Diffusion (HIBRID) imaging,” NeuroImage, vol. 150, pp. 162–176, Apr. 2017.