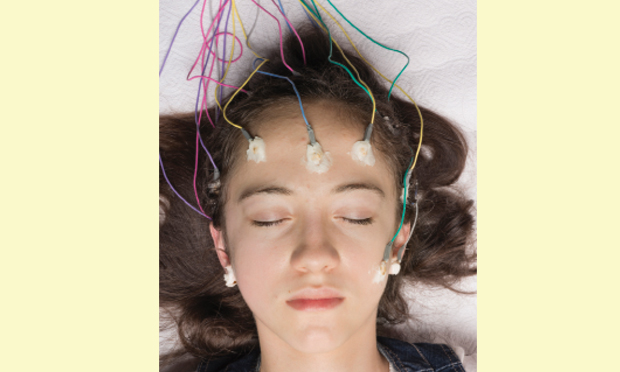
Hans Berger published the first human electroencephalograph (EEG) recording in 1924 [1]. He used a device called the string galvanometer to record brain waves on a light-sensitive plate. The fluctuating potential difference from the scalp oscillated at eight to 13 cycles per second (alpha rhythm) when an individual closed his or her eyes and remained relaxed but awake. Berger noted that when a person fell asleep, the alpha rhythm disappeared. Amazingly, to this day, the alpha rhythm disappearance remains the primary marker for defining sleep onset. Years later, Carl Ludwig invented a kymograph (the “wave writer”) that used a stylus to record electroencephalographic oscillation on a rotating drum. Later, an alternative approach evolved so that the brain wave recordings were inked onto a roll or fan-folded continuous paper strip moving at a constant speed. Mechanical engineers gradually improved the drive mechanisms for moving paper by using rotating sprockets, pinch rollers, and pressure plates. Gear mechanisms were also incorporated to permit speed changes.
In 1938, Albert Grass’s EEG machine (Grass Model 1) became commercially available, and scientists began describing the spectrum of brain electrical activity both during wakefulness and sleep. At Harvard University, Hallowell Davis recorded the awake–sleep transition, described the K-complex, and characterized the sleep spindle. A little more than 200 mi away in Tuxedo Park, New York, an 8-ft-long, 44-in-circumference drum recorder was constructed that enabled Loomis, Harvey, and Hobart (1937) to make the first continuous overnight sleep study. They could record half the night before the paper needed changing. Alfred Loomis was an eccentric and extremely wealthy lawyer-turned-Wall Street tycoon. He built the Loomis Laboratories in Tuxedo Park and funded scientific research by the likes of Heisenberg, Bohr, Fermi, and Einstein. Loomis invited Davis to Tuxedo Park, offering to fund his EEG research. Davis accepted.
The sleep group at Tuxedo Park described alpha, spindles, “random” activity, and slow waves and established distinctive states of sleep. They correlated these with movements, dreams, and responses to external stimuli. Interestingly, they recorded and described eye-movement activity but did not report any association with dreaming. In 1938, Jacobson published a book called The ABC’s of Restful Sleep for the Average Person. In it, he wrote, “When a person dreams… most often his eyes are active.” Nonetheless, the association between eye movements and dreaming was not described in the scientific literature until 1953, when Aserinsky and Kleitman published their electrooculograph (EOG) findings in Science.
Scientists and biomedical researchers then began exploring sleep physiology, with special attention to differences between rapid-eye-movement sleep (REM sleep) and nonrapid-eye-movement sleep (NREM sleep). To facilitate communication and systematize recording techniques for EEG, EOG, and electromyograph (EMG) signals, an ad hoc committee was formed and ultimately developed “A Manual of Standardized Terminology, Techniques and Scoring System for Sleep Stages of Human Subjects.” The committee categorized sleep into five distinct “sleep stages” and wakefulness. These sleep stages, based on EEG, EOG, and EMG characteristics, established normal sleep architecture as a universal and, to some extent, predictable set of processes. At this point, standardized polysomnography, at least for sleep staging, was established, and a new research arena opened that was ripe for discovery!
Signal Analysis for Sleep Research
Analyzing sleep-related brain electrical activity constituted the initial main focus for technically minded researchers. Bioengineering and biomedical researchers quickly teamed up. Polysomnographically recorded signals were transformed for computer analysis with analog-to-digital converters (ADCs). Once in digital form, a wide assortment of computerized signal processing techniques could be applied, including Fourier analysis, period–amplitude analysis, complex demodulation, wavelet detection, and synchronicity analysis. Problems such as aliasing, multiplexer crosstalk, and ADC bit resolution received much attention, and solutions were found. In the clinical realm, spike and sharp wave detection for epilepsy evaluation became a hot topic. In sleep research, we analyzed sleep spindle activity (especially changes associated with drugs), slow wave activity (as a marker for sleep’s homeostatic process), and alpha EEG intrusion (to assess sleep disturbances). Data displayed as activity versus time or in three dimensions (with time on the z-axis) as compressed spectral arrays provided impressive representations of brain activity across the sleep period. Notwithstanding these engineering feats and improved scientific understanding of sleep processes, polysomnography’s long-sought “holy grail” (to automatically classify sleep stages) remained elusive.
Application to Sleep Medicine
Traditional Methods
When I began my career in sleep medicine nearly four decades ago, we recorded polysomnograms on fan-fold paper. Each 30-cm page contained
30 seconds of data (referred to as an epoch). Thus, by night’s end, we typically had a 840–960-page recording requiring review, analysis, and interpretation. Recordings included EEGs, EOGs, EMGs (from the chin submentalis muscle), air flow (using temperature transducers placed at the mouth and nose and a pressure transducer placed in the nose), respiratory effort (using bands or a vest with sensors indicating abdominal and chest expansion), leg movements (derived from each leg’s anterior tibialis EMG), oxyhemoglobin saturation level (with pulse oximetry), and a single-channel electrocardiogram (ECG). To begin the process, each page would be classified according to sleep-stage scoring rules. Then, any abnormal sleep-related breathing event would be noted, classified, and counted. Abnormal breathing episodes associated with declining blood oxygen concentration and/or terminated by brief awakening were tabulated. We also counted leg movements (both periodic and aperiodic) and noted how many seemed to produce arousal. Finally, in a page-by-page review, we hunted down any and all ECG abnormalities (e.g., ventricular tachycardia, atrial flutter, and asystole).
Transition to Digital Recording
The microcomputer revolution brought many changes. Within 20 years, paper polysomnography became nearly extinct, replaced by digital systems. Interestingly, the main driving force was not the amazing analytic and data-processing potential offered by computerization. Nor was it improved efficiency or productivity. Surprisingly, it was mainly the elimination of paper and its attendant need for storage and retention. To a large extent, clinical sleep specialists continued (and still continue) doing mostly the same thing they have since the field first evolved. However, work is now performed at a desk with a large display screen, a keyboard, and mouse rather than at a table, flipping through hundreds of pages of recordings.
Computerized sleep-stage scoring to characterize sleep architecture turned out to be a much more challenging task than initially thought. Several factors contributed to the difficulty. The first obstacle involved artifacts. Movement, sweating, twitching, body position, unwanted signal imposition to other recording channels, sensor dislocation, electrical noise, and recording problems can all erode or modify the target electrical signal. Most are easily recognized and filtered out by humans who continually reprogram their recognition schema based on experience. Each of the hundreds of signal changes artifactually produced requires programming. Ironically, a European group ultimately accomplished the task just before the standard manual underwent revision. The other main factor, simply put, is that the standards were developed for normal sleep. The application, however, usually involves abnormal sleep. A disconnect sometimes exists between the two.
Sleep-disordered breathing (also known as sleep apnea) inexorably changed sleep medicine. The discovery and understanding of sleep apnea’s seriousness and morbidity led to widespread use of polysomnography as a diagnostic procedure. In Silicon Valley parlance, sleep apnea was polysomnography’s “killer app.” The need for sleep staging became secondary to determining respiratory disturbance index and oxyhemoglobin desaturation durations. To some extent, this trend has run its course and cardiopulmonary recorders (with just air flow, respiratory effort, oximetry, ECG and/or snore sounds) are fast replacing polysomnography for routine sleep apnea diagnostics. The time may be ready for digitally added value to polysomnography. With the juggernaut of sleep apnea diagnostics largely moving into the cardiopulmonary recorder’s domain, the census of more difficult, complex, sleep disorders should proportionally increase in polysomnographic sleep testing facilities.
The Road Ahead
Now is the time to infuse digital polysomnographic systems with those things computer systems should provide: efficiency, productivity, and the ability to realize new horizons. On the EEG analysis side, specific event detection, tabulation, and analysis could save clinicians time and provide clinically useful data. Specifically, quantitating central nervous system arousals (to index sleep fragmentation), cyclic alternating patterns (to assess sleep stability), sleep spindle activity (to gauge NREM strength), slow-wave power (to measure sleep depth), and alpha-delta activity (to verify pain problems) would all require considerable effort if performed manually. In the respiratory realm, analyzing ECG signals with cardiopulmonary coupling offers new metrics to diagnose sleep-disordered breathing. Finally, with respect to sleep-related movement, teeth grinding, hypnic jerks, rhythmic movements, fragmentary myoclonus, and REM sleep behavior disorder movements are a wide-open field. Digital analysis has barely scratched the surface and seems focused only on the simplest aspects of periodic leg movements.
To code, or not to code—that is the question. But there is a rub. When designing any new tool, it must serve a useful function in performing an established job. If not, the tool will not be used. Thus, graphics and metrics developed for polysomnography should serve a clinical need. Their accuracy must be validated. Accuracy must persevere both in ideal circumstances and under adverse conditions (i.e., in the presence of artifacts). As cardiopulmonary recording siphons off polysomnography’s easiest applications, more complex sleep disorders with more subtle biomarkers will become the sleep laboratories’ mainstay. Clinicians will welcome better, faster, and more innovative polysomnographic signal processing techniques and analysis.
Max Hirshkowitz (max.hirshkowitz@gmail.com), Ph.D., D.A.B.S.M., is a professor in the Department of Medicine at the Baylor College of Medicine, Houston, Texas, and the director of Sleep Disorders and Reseach at the Veteran Affairs Medical Center.