“It is a capital mistake to theorize before one has data,” said Sherlock Holmes creator and author Arthur Conan Doyle in 1887. In this era of big data, and especially the crush of medical information becoming available through new technologies and bulging databases, Doyle’s quote could be updated to: “It is a capital mistake to theorize before one has data and understands what they mean.”
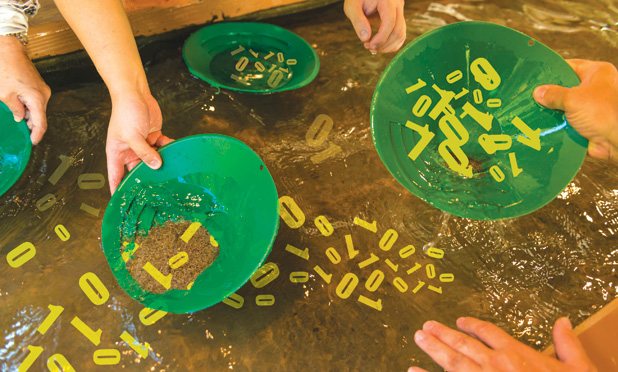
That brings data mining to the forefront. If scientists can separate what they need from what they don’t, find germane patterns, and identify key interrelationships from the data, they can put toeholds into what is otherwise an impenetrable mountain and truly begin to climb. Nowhere is the relevance of data mining more evident than in the water crisis of Flint, Michigan [1]–[3], once an automobile boomtown about an hour’s drive north of Detroit and now a struggling and economically depressed city. The discovery of lead in its water supply came after Marc Edwards, a civil engineering professor from Virginia Tech, got a call from a Flint resident who suspected her water had become tainted after April 2014, when the city switched its water source from the expansive Detroit water system to one that draws water from the Flint River. Edwards asked the resident for a sample, tested it, found extremely high lead levels, and followed up by conducting a wider sampling of residential water. His results showed widespread elevated lead levels.
Although Edwards’s findings were not enough to incite remediation efforts, they did draw the notice of physician Mona Hanna-Attisha. She is director of the pediatric residency program at the local Hurley Medical Center and fully understood the dire medical implications of lead to her young patients. These include developmental delays, learning difficulties, behavioral problems, and gastrointestinal issues.
Hanna-Attisha accessed her hospital’s records and ran an analysis of lead screenings taken in children under five years old both before the switch to the new water source (1 January– 15 September 2013) and afterward (1 January–15 September 2015). Among the entire group in the city, she found that the percentage of children with elevated blood-lead levels, which are defined as more than 5 g/dL, jumped from 2.1% preswitch to 4.0% postswitch. The analysis also showed that certain geographic areas of the city were especially hard hit, with the percentage of those having elevated blood-lead levels rising from an average of 2.5% preswitch to 6.3% postswitch. Ultimately, Edwards’s testing of water samples and Hanna-Attisha’s data-mining analysis brought the lead problem into the national spotlight and spurred government action to address the crisis.
The Social Side of Data Mining

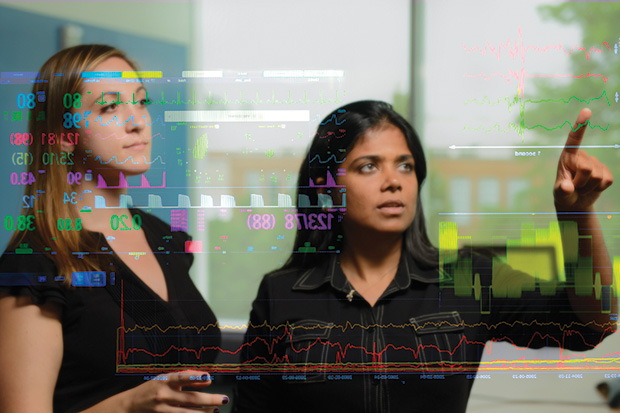
For the Flint water crisis, Hanna-Attisha mined hospital-collected health data, but researchers are also looking to other data pools, including social media, to find evidence of possible health problems. One of those researchers is Elaine Nsoesie (Figure 1,right), assistant professor of global health with the Institute for Health Metrics and Evaluation at the University of Washington. She is taking advantage of all the information people are already so willing to share online, with an eye toward catching community health problems when they arise, or as close to that point as possible.
That can be especially difficult with foodborne illnesses. Although one in four Americans gets a food-borne illness every year, most people never seek medical attention, which means that health agencies frequently have very little data to identify an outbreak or to track it to its source. Nsoesie (then at Boston Children’s Hospital and the Harvard Medical School) and her collaborators set out to assess whether crowdsourcing by way of restaurant reviews held potential as a surveillance tool that could help public health departments spot outbreaks before too many people got sick. In all, their study assessed reviews of 5,824 food-service businesses from 2005 to 2012 and found that those foods implicated by the reviews in food poisonings closely reflected those noted in actual outbreak reports from the U.S. Centers for Disease Control and Prevention (CDC) and also appeared in similar proportions [4].
Encouraged by those results, Nsoesie and her research group expanded the model to include data gathered from Twitter posts and also began working with local public health departments to develop a food-borne-disease surveillance “dashboard” that officials could employ to identify and curb outbreaks [5]. She explains, “We wanted health departments to be able to get this information from social-media sources and use it to help them decide whether they should conduct a restaurant inspection or investigate a particular food that seems to be the source.”
For this system, the research group hired interns to read through thousands of reviews and tweets, not only to help establish a list of keywords associated with food-borne illnesses but also to uncover subtle differences that can change a statement’s intent (e.g., “The food was so bad, I can’t believe I didn’t get sick!” versus “The food was so bad, I got sick!”). They then incorporated text matching to filter reports and machine learning to extract the relevant reports. “We began working with a public health department in 2015, so the system is currently running and department officers are receiving illness reports,” Nsoesie says. Officers can also contact the Twitter users or review posters for more information and ask them to follow a unique link to a form where they can share pertinent details. It’s still early in the project, but she hopes the system will improve food safety. “We want people to understand what’s going on in their communities so they can make better decisions about their health.”
While that work continues, Nsoesie and the research group are also developing similar systems using tweets to detect outbreaks of influenza and influenza-like illnesses as well as Dengue fever, a mosquito-carried and mainly tropical disease that causes sickness in nearly 100 million people each year. The work with Dengue revealed a gap that could affect the veracity of such systems, she says. “With tweets, we can look at the locational distribution, and our data from Brazil showed that we were tending to capture particular populations within the country (especially people in higher socioeconomic groups) rather than the entire population. That means that we have to be careful about the kinds of inferences we’re making.” The researchers are contemplating ways to rectify this problem, including using data-integration approaches to fill in gaps in data.
With illness tracking, the goal is to monitor disease spread in real time, Nsoesie notes. “The main benefit of models for influenza and other diseases is timeliness. Currently, the tracking information we’re getting from the CDC for influenza is usually delayed by two weeks and retrospectively updated, whereas data from Internet-based sources, such as social media, provide a more immediate view of what’s happening on the ground.”
Alliance for Good
Besides mining data to identify health issues and reduce the spread of outbreaks, researchers are also looking at how to drill into information to keep people safe and healthy. “Data really are the fodder for insights, and it’s the insights that we are after,” says Rasu Shrestha, M.D. (Figure 2, right). Shrestha is a driving force behind the Pittsburgh Health Data Alliance, a collaborative effort among Carnegie Mellon University, the University of Pittsburgh, and the University of Pittsburgh Medical Center (UMPC). The idea behind the alliance was to bring together researchers, innovators, and clinicians to glean meaning from big data and parlay that into products to benefit patients, health care professionals, and the industry overall, he says.
Although the alliance was only announced in March 2015 [6], it has already funded a half-dozen projects, including one designed to take on one of the most common and dangerous problems facing elderly patients: injuries from falls. The project is called the Fall Sentinel, and it allows clinical pharmacists to gather data from an automated system continually monitoring patients in nursing homes and then scan for patterns in the collected data to correlate drug– drug interactions and other factors with the occurrence of falls, explains Shrestha, who is chief innovation officer at UPMC and executive vice president of UPMC Enterprises, the health system’s commercialization unit that funds the alliance. In addition to the injuries to patients, falls cost the national health care system about US$4 billion each year, he says, so this project could have multiple benefits.
Other Alliance projects include software to allow real-time mining of a cancer patient’s genomic data and provide relevant information to oncologists to help direct personalized treatments. It could potentially be useful in identifying genetic drivers of cancer, which could in turn lead to new cancer drugs. A separate software project is under way to analyze complex tumor images and more accurately diagnose breast cancer. Another project utilizes data collected from sensors and wearable devices to observe the movements of hospital patients and predict which may be at risk of pressure ulcers, a major health issue affecting millions of U.S. patients every year.
“We think the Pittsburgh Health Data Alliance is going to be of tremendous benefit to our patient population,” Shrestha asserts. “We’re also hoping that this effort at large—the researchers, the clinicians, and the data hub we’re creating—will attract other entrepreneurs and corporations [and] we will turn all of the talk about big data into action that will move the needle in big ways so that health care is transformed, not just at UPMC, but really nationally and globally.”
Decisions, Decisions…
A powerful way to transform health care is using assistive tools to simplify some of the decision making that is at its core. Health care professionals make dozens of decisions every day that can have profound effects on their patients’ health and well-being. Although medical care is improving by leaps and bounds, the escalating amount of health data and how those data relate to specific patients are making such decisions more and more complex.
In some cases, it is a matter of information overload, according to Suchi Saria (Figure 3), assistant professor with the Machine Learning and Data Intensive Computing Group at Johns Hopkins University’s Department of Computer Science. “The best physicians are very good at this: looking at collections of disparate data coming in, considering the patient’s clinical history, including bad reactions to medications or presence of other conditions in the past, and information from other specialists who may be giving the patient medication for a comorbid condition—say, managing their respiratory issue or a renal or heart problem—and how these should factor into determining the treatment the patient should get.” Not only that, these decisions often have to be made quickly: for example, intensivists (critical care physicians) can be simultaneously responsible for 20–30 patients, she adds. “Being able to stay on top of all that data and make good decisions all day every day is pretty challenging.”
In other cases, the complexity of the disease poses a challenge to even the best physicians, Saria says. “Many diseases like autism, lupus, and asthma show tremendous variability across individuals, and that causes clinicians to struggle with the path the patient is likely to take and their best course of treatment.” In these cases, she notes, computational subtyping, a new way of approaching diseases, can help [7]. “What computational subtyping can do in such cases is break down the disease into subtypes, each of which defines a typical pattern of presentation. For a new patient, if we can identify their subtype, it gives the clinician a clearer picture of their disease trajectory and can inform which treatments will have the most positive effect” [8].
Saria’s group has its focus on those autoimmune diseases with tremendous heterogeneity, such as scleroderma, multiple sclerosis, and lupus. “What we’ve done is taken 20 years worth of data—clinical measurements accumulated in the clinic during that time—and developed models that characterize the progression of the disease in unique subpopulations and the typical ways in which these subpopulations manifest this disease,” she explains. To dissect those 20 years of data, the researchers developed a statistical machine-learning framework that reviewed the data to find common patterns. “It’s a way to take the heterogeneous, often messy data, correct for any kind of noise sources that may be affecting the data, and figure out how to cluster them,” she says, noting that her group also considered input from expert clinicians who provided their own insights into patient variation based on their years of experience with the diseases. “The clinicians helped us evaluate whether the clusters we were discovering actually made sense. When we discovered error sources we hadn’t accounted for, we went back to the drawing board and improved the model.”
Based on these subtypes, Saria’s group has developed a prototype that takes a new patient’s data and prognosticates his or her likely subtype and disease trajectory. They are now working with clinicians to determine its reliability and to help them feel comfortable actually using it. It is important that they not think of this tool as a “black box” but instead understand how it came to the conclusion it did. “We want clinicians to make decisions collaboratively with the model,” Saria explains. Likewise, she wants patients to be able to engage with the tool so they can see their own data, interact with that data to see the effect of different medications on their particular subtype, and understand their disease trajectory under different circumstances.
Using similar techniques, her group has also developed tools for assessing data in the hospital. For example, she says, “in one study, we are trying to identify which patients will develop septic shock, a life-threatening condition resulting from a full-body inflammatory response.” By analyzing physiological and laboratory data that had been collected from patients in intensive care units, they devised a targeted, real-time early warning score, called the TREWScore [9], to recognize which patients were on the brink of septic shock. This, she believes, could allow clinicians to intervene earlier and therefore potentially save lives. “Overall, the point is to use the trove of data routinely collected to figure out how to make more targeted decisions that can improve patient outcomes and make practicing health care easier and simpler for clinicians.”
Big Data Revolution
Excavation of the big-data mountain is well under way. At its foundation are available data sets that promote understanding. Thoughtful collection of information through such efforts as the Kavli HUMAN project (see the article “The Case for Big Data” on page 45) serves that goal of gathering the wide swath of longitudinal data researchers often need to see patterns, develop useful computational models, and make assistive tools to aid clinicians.
“There’s definitely an explosion of data, but what’s really important as it pertains to our health is how to leverage data, including that being generated by wearables, sensors, and other surveillance-type devices, as well as social determinants of health, genomic information, and data related to disease outbreaks,” remarks Shrestha. “With all of that data hitting us, we need to decipher the signal-to-noise ratio and really get at specific capabilities to connect the dots across these data elements and come up with patterns that can provide meaningful insights that are relevant and actionable back at the point of decision making.”
The benefit of big data lies in its applications, he adds. “Every person is a snowflake: we’re similar and yet unique. The question is how do we not just make broad brushstrokes in the way that we are imparting care to our patients, but instead really personalize the care by looking at the insights that we’re gleaning from the data. That really is the overall goal of this effort.”
References
- Bridge Magazine. (2016, Feb.). Disaster day by day: A detailed Flint crisis timeline. Bridge Magazine. [Online].
- C. Itkowitz. (2016, Jan. 27). The heroic professor who helped uncover the Flint lead water crisis has been asked to fix it. Washington Post. [Online].
- FlintWaterStudy.org. Pediatric lead exposure in Flint, MI: Concerns from the medical community. [Online].
- E. O. Nsoesie, S. A. Kluberg, and J. S. Brownstein, “Online reports of foodborne illness capture foods implicated in official foodborne outbreak reports,” Preventive Med., vol. 67, pp. 264– 269, Oct. 2014.
- J. B. Hawkins, G. Tuli, S. Kluberg, J. Harris, J. S. Brownstein, and E. Nsoesie. (2016). A digital platform for local foodborne illness and outbreak surveillance. Online J. Public Health Informatics. [Online]. 8(1), p. e60.
- Pittsburgh Health Data Alliance. (2015, Mar. 16). Pitt, CMU, UPMC form alliance to transform health care through big data. News release. [Online].
- S. Saria and A. Goldenberg, “Subtyping: What is it and its role in precision medicine,” IEEE Intell. Syst., vol. 30, no. 4, pp. 70–75, July–Aug. 2015.
- M. O’Brien and A. Kellan. (2015, Nov. 23). Big data to individualize management of chronic diseases. Science Nation. [Online].
- P. Schulam and S. Saria. A framework for individualizing predictions of disease trajectories by exploiting multi-resolution structure. Presented at Neural Information Processing Systems 28 (NIPS 2015). [Online].
- K. E. Henry, D. N. Hager, P. J. Pronovost, and S. Saria, “A targeted real-time early warning score (TREWScore) for septic shock,” Sci. Trans. Med., vol. 7, no. 299, p. 122, Aug. 2015.