
Like eight-year-olds who can’t let go of a good joke, Larry Smarr’s nurses and doctors kept coming to him with the same question: “Have you passed gas yet?” Answering this question in the affirmative is, Smarr explains, deadpan, “the state of the art in 2017 in the medical community for deciding when your colon restarts.”
Smarr was recovering from a colectomy—removal of a section of his colon due to Crohn’s disease. Peristalsis does not immediately start up again after the surgery. The nerves in the colon have to “go through a learning process,” Smarr says, “to figure out the new spatial layout.” Passing gas is traditionally the first sign that the colon is back to work—thus, the line of questioning.
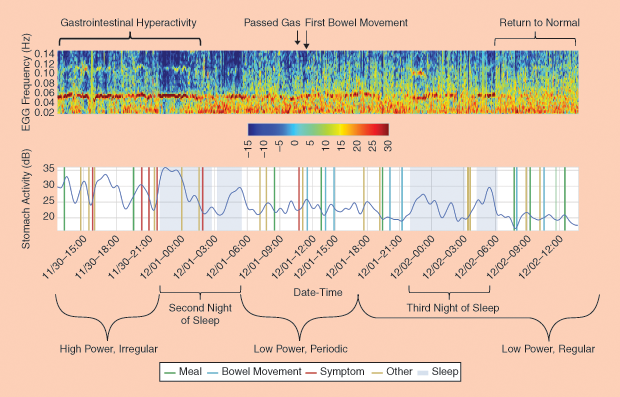
However, Smarr had a better idea for measuring his recovery: Armen Gharibans visited his recovery bedside to apply a dozen electrocardiogram (EKG) electrodes across Smarr’s abdomen, allowing Gharibans to create an electrogastrogram (EGG). Gharibans is a member of Todd Coleman’s bioengineering lab at the University of California, San Diego (UCSD). Taking 250 measurements per second, the EGG data allowed Coleman’s lab to detect when the colon’s electrical activity switched from a chaotic mode to regular (Figure 1). Smarr’s colon was up and running.
Meet the (Quantified) Patient of the Future
Smarr’s postop EKG getup was possibly the first time a postsurgical patient has been wired like that. But implementing a system to measure the unseen workings of his body is by now routine for Smarr, 69, who became known decades ago as a computer scientist, advancing an early form of the Internet. These days, he’s got a reputation as a “patient of the future,” known perhaps as much for the three-dimensional (3-D) digital model of his colon as he is for detecting biomarkers for Crohn’s disease in his body before he had developed any external symptoms.
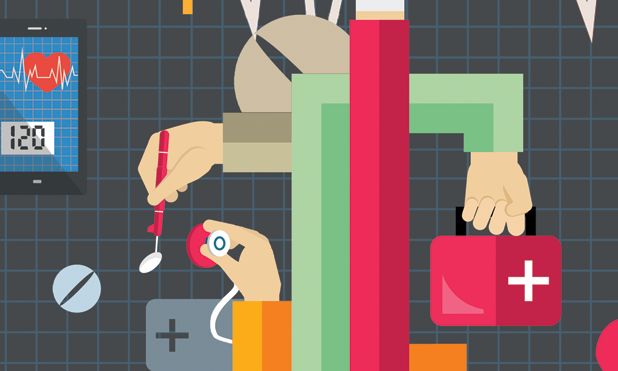
Currently, Smarr is a high-profile practitioner of the Quantified Self (QS) movement. The term describes individuals who engage in self-tracking all manner of biological, physical, or behavioral in- formation. They record and quantify everything from their heart rate and heart rate variability (HRV) (two distinct measures), to mood shifts from one day to the next, to microbes in their stool, to how much time they spend sitting or sleeping and the quality of that sleep. The tracking devices they use could be Fitbits, homemade cop- per sensors taped to chair hand rests, or apps tailored to the area being tracked. Sometimes, self-trackers order blood tests or send out stool samples through the mail.
QSers, as they’re known for short, have meetups in cities all over the world and an annual conference where they present personal projects, share technology tips, and sometimes weigh in on in- terpreting another’s data. While their motives and methods are various, most share the conviction that data—precise, regular, and graphed—provide the route to sharper self-knowledge (See “QS Technology Wish List”). Not all QSers are focused on their health—maybe only one-third, according to one informal estimate. Smarr is one of them, and he believes, at least in his own case, that his self-tracking can demonstrate, in N = 1 fashion, how radically different health care could be in a decade.
[accordion title=”QS Technology Wish List”]
- Most wanted: Noninvasive continuous glucose monitor
- Hoping for another incarnation: Inexpensive blood tests
- Gone but not forgotten: Zeo (sleep-state monitor)
- Favorite new technology: Todd Coleman’s high-resolution electrogastrogram
- Most excited about: Empathic voice-activated apps and bots
[/accordion]
Five years ago, Smarr predicted for Atlantic magazine that by 2030, there wouldn’t be “that much more to know” about the genomic bases and bacterium of an individual. By then, he believes, individuals will have their bodies’ “wiring diagram,” which they can use along with their doctors to maintain or mend their bodies the way we do our cars, including with preventative care.
Today, Smarr believes the ongoing digital transformation of medicine is “probably going faster than I had assumed.” This vision for the future is encompassed by Leroy Hood’s “P4” medicine: predictive, preventative, personalized, and participatory. Health care, in this view, will be decentralized from the physician to the individual. The transformation, Smarr believes, would enable our system to finally live up to its name—a health care system instead of a sick care system.
Advance Intel Reduces Surgery Time
What might this “wiring diagram” and shift in patient–physician interactions look like? Smarr’s approach to his November 2016 colectomy offers a preview: “Normally when a doctor thinks of an informed patient, it’s somebody who has come in with some printouts from Web MD. Not that they come in with a full virtual reality transparent model of themselves.” Smarr is referring to the robust—and unorthodox—file he brought to his surgeon, Dr. Sonia Ramamoorthy, and her team prior to the surgery.
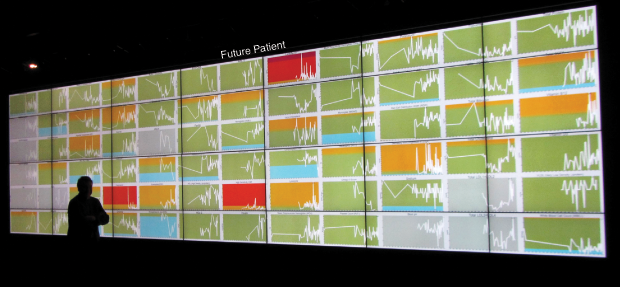
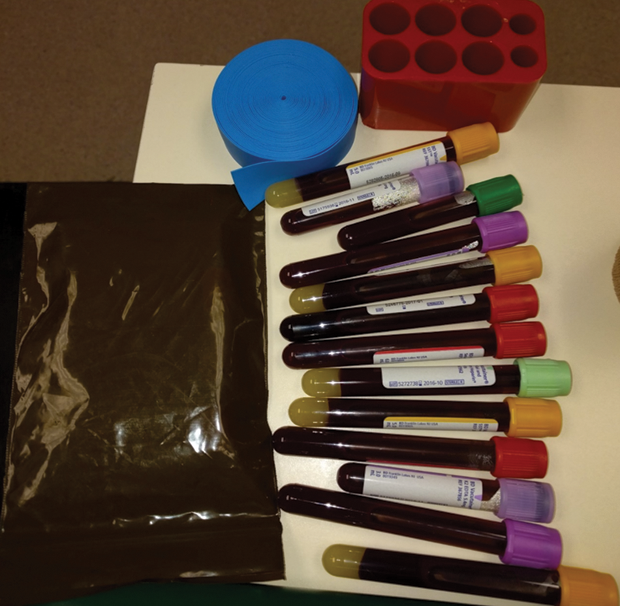
Smarr’s arsenal of computer models and scalable 3-D images of his colon were the result of nearly a decade of self-tracking, including regular blood and stool testing that enabled him to monitor and graph over 100 biomarkers in his system (Figure 2). In 2012, Smarr collaborated with UCSD radiologist Cynthia Santillan and virtual reality expert Jurgen Schulze to create 3-D images of his colon from magnetic resonance imaging (MRI) slices (Figure 3). This 3-D colon model was turned into an immersive lab known as “the CAVE” at the California Institute of Telecommunications and Information Technology (Calit2), which Smarr founded and directs. Visitors to the lab can walk through an outsized reproduction of Smarr’s colon.
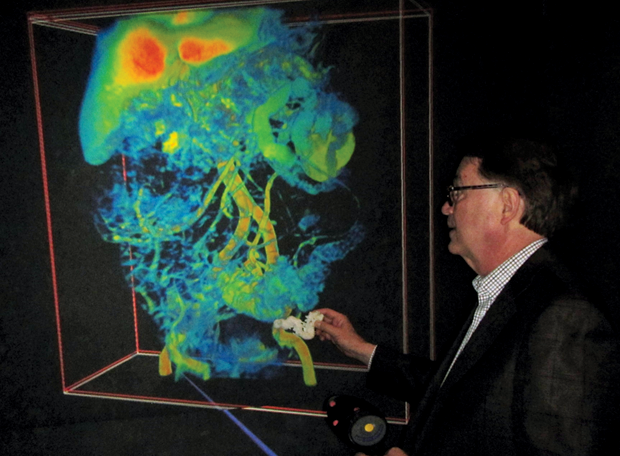
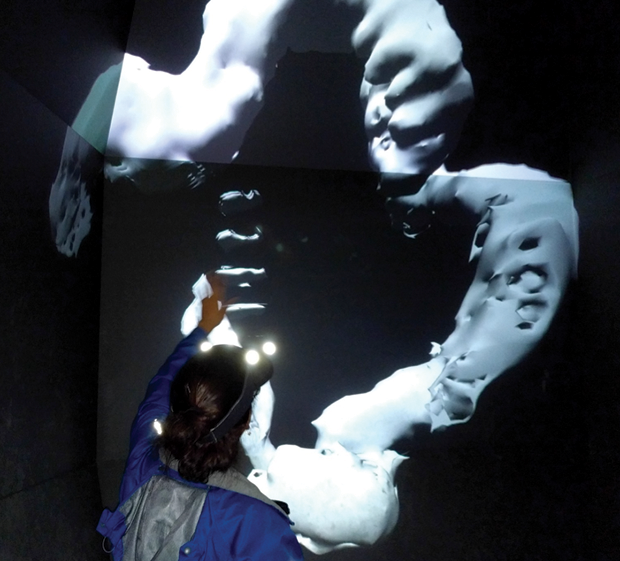
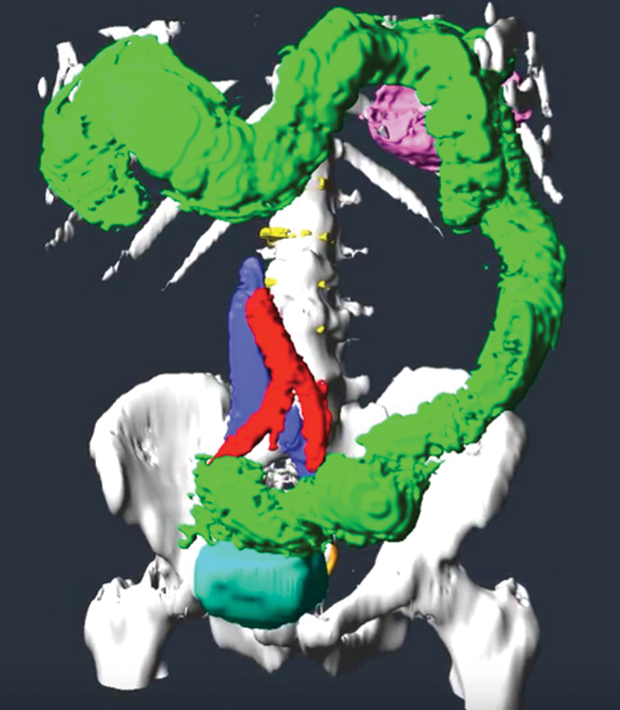
For the colectomy, Smarr worked with Schulze, who specializes in 3-D interactive visualizations at Calit2, to create a scalable 3-D map of Smarr’s abdominal organs that Ramamoorthy could study prior to surgery in the Calit2 virtual reality CAVE (Figure 4). This visualization gave Ramamoorthy useful information both for presurgical determination of where to make the two cuts and in the operating room to increase “situational awareness” during surgery. The model also revealed that Smarr’s transverse colon was not textbook. Instead of lying horizontally across and then turning straight down, Smarr’s colon went “down, up, down” and the end section was connected to the spleen (Figure 5).
With this advance intel of Smarr’s abdominal landscape, Ramamoorthy saved an estimated 45 minutes of surgery time. Smarr explains how: “If she had used the standard holes to put the rods through and attach to the [DaVinci] robot arms to do the surgery, assuming she was just doing it at the bottom of [the] pelvic region, she wouldn’t have been able to reach up to the spleen and do the work that was needed” and where she spent most of the time operating. “She would have had to actually undock the robot, cut new slits, put new steel things in, [and] redock the robot,” he explains.
“Quantified Surgery,” as Smarr dubs it, is like a pilot using a flight simulator before taking off in actuality. Sure, surgeons are aces at assessing a patient’s organ terrain on the fly while operating, but having a simulation is a boon. “[Virtually, in the CAVE], we could look at the 3-D colon and actually figure out where to make the cuts,” recalls Smarr.
Ramamoorthy’s strategy was based not only on a view of Smarr’s organs that was a couple weeks old but also on a view of his body on a flat plane. Her surgical table would be inclined. Given these differences, was it possible for the visualization, which she’d be referencing during the surgery as well, to mislead instead of guide? Google map cautionary tales come to mind—stories of drivers so fixated on their screen’s version of the world that they drive off a cliff.
Could Smarr imagine a scenario in which the surgeon does the equivalent of crash through a wall because the patient visualization he or she is operating under does not match the actual state of the patient being operated on? No, Smarr replies. “People make this mistake of thinking it has to be identical to the way your body is laid out. … That doesn’t matter. … Surgeons think in 3-D. It’s like a quarterback that, as the play develops, is able to look all over the field, see how things are changing, and make a decision. However, that quarterback has watched a lot of videos of the opposing team, and so they have in their heads the likely layout of what the [players] are going to do. … That’s the way [the surgeon] uses [the 3-D model],” he explains.
Self-Tracking to Walk Farther, Recover Faster
Smarr’s time-saving Quantified Surgery had other positive ripple effects: less time under anesthesia and less time undergoing surgery in what’s considered a high-rent district of the body— chock full of “aortas and vena cava and more neurons than anywhere in your body other than your brain”—all of which contributes to a faster recovery.
Smarr also credits his QS with speeding his recovery by giving him a precise way to measure and set goals for his physical activity in the days after the surgery. Colectomy patients are encouraged to walk as much as feasible to aid recovery.
“Well, how much walking?” Smarr wanted to know. “If you’re waiting for the doctor or nurse over two weeks to tell you how much to walk that day, that will not happen.” Add to that the disincentive of pulling an IV pole and oxygen tank along for the stroll. But if walking was important, Smarr was determined to do as much as he could.
“Because I had my Fitbit, I could quantitatively set a goal. Before surgery, I had done 10,000 steps a day, five miles. … [So, I] set a goal to be back to 10,000 steps by two weeks. … I didn’t want to overdo it, but it was a stretch goal,” he concedes. “And I think that’s the point: that you can set a stretch goal for yourself, but you have to have the data personally to determine if you’re on track or not.”
Two weeks later, Smarr had attained his stretch goal, and he was walking 10,000 steps a day. He can’t say if this is twice as fast or three times farther than the recovery rates of the average colectomy patient. There isn’t any data on it. “That’s the other thing that’s crazy: there’s no statistics [on recovery rates],” Smarr adds. “If all you did was have a Fitbit on each patient, you would have all that data. You would know.” But we don’t. All he can say is that his doctors called it a “miracle recovery.”
This Future Isn’t for Everyone
Smarr may be an evangelist for self-tracking, but, paradoxically, he doesn’t see himself as a model for others. “I’m not saying people should do what I’m doing,” Smarr clarifies, “because I realize it’s fairly extreme. It’s a scientific experiment, and out of that comes the knowledge by which we can speed change in the system. Think of it as an expedition to the future.”
In the future envisioned by Smarr, the patient is the primary keeper of his or her health data, potentially better equipped than a doctor to detect when something is awry—as Smarr did when he detected the raised levels of the C-reactive protein (CRP) in his blood and brought it to his doctor’s attention (see Figure 6). The CRP pointed to inflammation and was an early indicator of problems in Smarr’s colon.
It seems hard to argue with the prospect of patients tracking and recording more data about themselves. But not all in medicine see this as a positive turn. Some, like Dr. Gilbert Welch, author of Overdiagnosed: Making People Sick in the Pursuit of Health, see potential harm in early detection and the belief that early and aggressive treatment is always the best path. Their concern is that overattending to tests and frequent tracking of biodata could lead to alarmist reactions when anomalies get spotted. Not every irregularity or flux in the body warrants an intervention, they say, and interventions—especially surgery— can increase risks for patients while not always improving health.
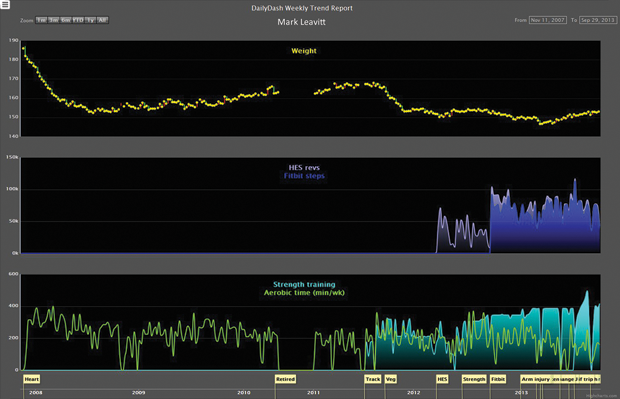
This argument isn’t compelling to Mark Leavitt, a former engineer and retired physician who is one of the leaders of the Portland, Oregon, chapter of the QS movement. He admits that there’s a risk for QSers of becoming worried about something they’re tracking (Figure 7). “But there’s far more danger in ignoring your body,” Leavitt reasons. “For every one person who’s obsessed, there are 1,000 people who are failing to pay attention to their body and doing themselves harm. Perhaps that number is one million.” In other words, self-tracking is more likely to help than to harm.
Melanie Swan, a technology futurist who’s written about the QS movement’s disruptive potential on big data science goes even further in her defense of self-tracking. She believes QSers are less apt to jump to erroneous interpretations because they are more deeply versed in their own variability. “The whole benefit of QS tracking is that you get many data points. You don’t just get a couple. Whereas [with] an annual blood test, if the figures are off one year, I think there’s more possibility of an alarmist reaction. … My norm is not that of somebody else’s,” Swan points out.
To Swan, discovering one’s own baseline data is the benefit of self-tracking and knowledge less likely to be gleaned from infrequent or annual tests. Having this self-knowledge, she says, is the foundation for anti-aging interventions as well as preventative health.
Impediments to a Swift QS Revolution in Medicine
To many, though, the question isn’t whether individuals should use self-tracking to become more proactive in their health care but what obstacles exist that impede them from doing it. For one, there’s the universally acknowledged pace at which change comes to medicine: it’s glacial. That said, there’s also the universally acknowledged good reason for this slowness to change: namely, the life-and-death stakes of medical care. “It’s a conservative change discipline for a good reason,” says Smarr.
Additionally, any system change that will spawn workflow changes (as the Quantified Patient would) takes time. Smarr points to the 15-year delay between introducing the personal computer (PC) to business, for instance, and seeing an increase in productivity from the technology shift. “All the things they were doing without the PC—that whole part of the workflow had to be modified.” Integration of QS data into medicine may be most successful if it follows the path of laparascopic surgery, Smarr says: “A few individuals get it going, then you do a pilot study of more patients. … Then you do, maybe not a full clinical trial, but you have to do things that verify that this is safe.”
The sensitivity of health data and its siloed state are additional impediments to the ways that individuals’ biodata could feed into population health data science. “[Health data information is] big, it’s complicated, it’s messy, it’s noninteroperable, and it’s in private silos,” says Swan. The countries making inroads to marshalling big health data are those with nationalized medical systems or a single-payer system—places like Switzerland, the United Kingdom, and Nordic countries. “The biggest genome databank [in the United States],” Swan says, “only has on the order of thousands of people’s genomes, and we really need the set to be hundreds of thousands and millions, million-genome databases, for us to really understand these big health data problems.” There’s no business model for an open data commons.
Forget sharing—sometimes, just gathering their own data for personal reference causes headaches. When a device is discontinued or a QSer wants to change models, data losses or gaps invariably occur. “Pulling data together from different pieces of software [has meant] that every time a piece of software or device gets updated or upgraded, the interfaces break,” says Leavitt, who has taken daily readings of his HRV to see if it correlates to his willpower in terms of eating and exercise choices (Figure 8). “[Device manufacturers] never make it easy to gather the data together,” he adds.
The Time It Takes to Count
While data sharing and extraction are anything but seamless, the tracking itself requires little time or effort, according to the QSers we spoke to. Much of the data is gathered in the background by smartphones or wearable fitness trackers. Once the data tracking devices are in place, the time spent uploading daily measurements isn’t much. “A half hour,” reports Smarr, when asked how much time he devotes daily to self-tracking. The most time-consuming part of his routine, he says, is taking stool samples, freezing them, and logging them in a spreadsheet.
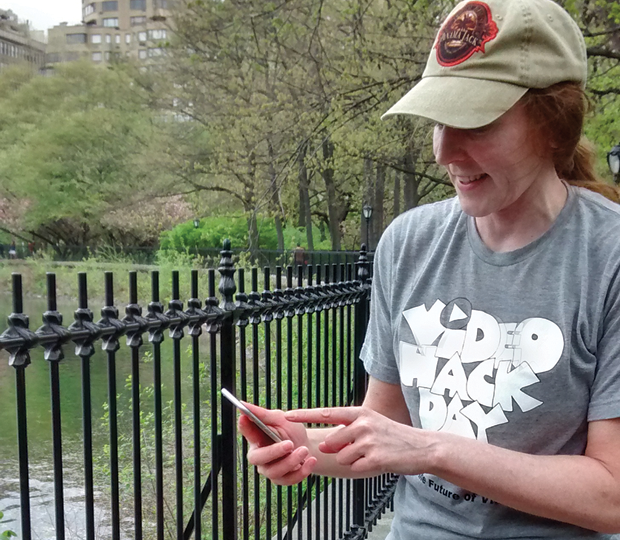
“A minute or less,” says Swan of her daily tracking time (Figure 9). “It takes Strava [a sport-tracking app] longer to load on my phone than it does for me to enter in my spreadsheet which workout I did today.”
Which is not to say that, for hardcore QSers and aficionados of data down to the finest grain, there aren’t some disruptions to daily life. “At one point, I was measuring every gram of material that went into my body,” Smarr recalls. “Every spice, everything—and then writing it down and putting it into a database and then looking it up on the U.S. Department of Agriculture database and converting that into calories, protein, fat, carbohydrates, salt, sugar, and fiber. All that basically meant [my wife and I] spent twice as much time eating and preparing food as normal.
“As I was going into the second month, my wife sweetly said, ‘Dear, either you are going to get a new wife or we’re going to finish this experiment.’”
Smarr replied, “You know, I think I’ve got just about enough data now.”
Get to Know Yourself Better
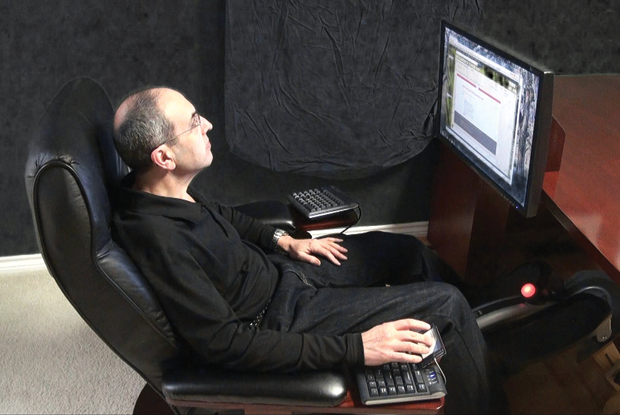
Yet, for any tale of lost perspective, a QSer can counter it with a story of gained perspective. Swan used to think of herself as an active person because she worked out a lot. Then, she started self-tracking. “I found out that [I was] moving for about an hour a day,” Swan says, “but otherwise, those other 23 hours, [I was] quite sedentary.” Leavitt’s self-tracking experiments also gave him a different view on himself. Photos of him using his self-designed elliptical exerciser/computer desk surprised him. “I realized I was really cranking my neck in a bad position while using it,” he says. So he made adjustments.
QSers track for different reasons, but a common inclination runs through many of them: to improve their personal health. They like to tinker, and they’re willing to experiment with themselves, but they want their interventions to count, which is to say, they want to know why and when something in their body changes, if it does. The only way to be sure, they feel, is to measure, precisely and systematically—every day if needed. If the future of medicine is to be more predictive, preventative, personalized, and participatory, then the QSers, armed with tracking devices, spreadsheets, and time series, are ready to show you how that future, for them, is already underway.