
Biomedical studies, both in research and in clinical applications, deal with the management of large amounts of data. Different sensors and transducers, advances in technologies, and the availability of innovative medical equipment and instrumentation all contribute to the ability to make biological measurements at different scales, ranging from systems, to organs, to tissues, to cells, right down to proteins and genes. Biomedical signals and data carry important information about the system or the organ that generated them.
In such a context, the role of signal, data, and image processing gains great importance and has evolved from a more traditional view centered on improving the quality of the signals or images to the multiparametric and multiscale paradigm of interpretative models. Currently, the processing of signals and data is often part of the measuring device itself (e.g., tomographic imaging), and a large part of the recorded information cannot be clearly interpreted or find clinical application without proper processing.
A significant motivation toward the development of new signal and image processing methodologies comes from collaborations with physicians and researchers who seek not only better signals and images but also data modeling for a better quantitative interpretation. In Italy, this has led to several different avenues of research, mainly related to signal and image processing of the cardiovascular system and brain function. Furthermore, in recent years, more emphasis has been placed on multimodal integration and multiscale approaches. Brief excerpts from groundbreaking research in different areas are given in the following sections.
Model-Based Signal Processing of Cardiovascular Regulation
The research on heart-rate variability (HRV) signals as a tool for the quantitative evaluation of the autonomic control of the cardiovascular system began in the 1980s and soon extended from HRV to other signals obtained from the cardiovascular and respiratory systems, including arterial blood pressure (AP), blood flow, and respiration.
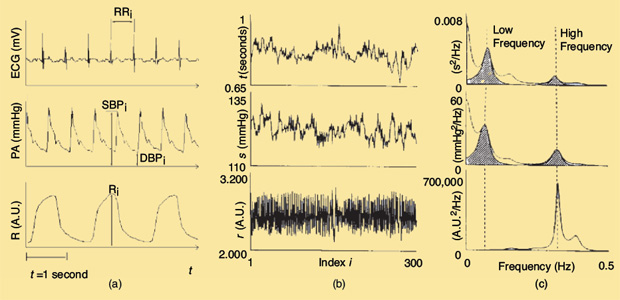
The time series extracted from cardiovascular signals on a beat-to-beat basis are analyzed both in the time and frequency domain, and quantitative parameters related to autonomic control are extracted. Figure 1 shows the three main signals that are usually considered: beat-to-beat series are extracted from the electrocardiogram (ECG), the AP, and respiratory traces. In particular, it is possible to observe the correspondence between rhythms present in the HRV signal and the activation of the sympathetic or the vagal branches of the autonomic nervous system. Experiments conducted on human subjects and animals, during ad hoc stimulations or following the administration of specific drugs capable of selectively inhibiting autonomic control, led to the discovery that, in a period of three to five minutes, corresponding to about 200–300 cardiac beats, precise relations exist between spectral peaks and autonomic functions.
In Italy, there has been a large body of literature that has helped define the basis for the frequency-domain methodology in the assessment of autonomic mechanisms controlling cardiovascular parameters. This has led to the definition of some important concepts, such as the sympathovagal balance, now a common part of the language in this field worldwide [1]. This rich production of research, including human and animal studies and physiological and clinical research, has led Italian bioengineering to assume a leading position. In fact, Italian bioengineers took part in the development of the guidelines for the clinical use of HRV [3], one of the most cited papers in the literature related to HRV.
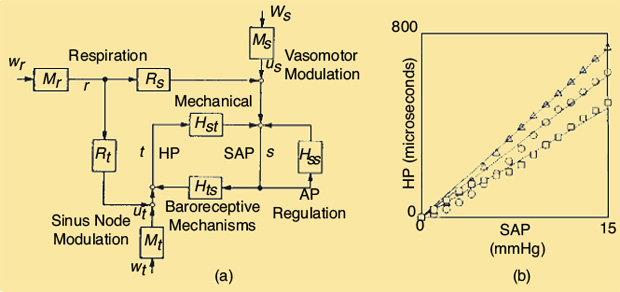
Figure 1 clearly shows that the beat-to-beat series extracted from AP and respiration have common rhythms with heart rate (HR), suggesting the presence of complex physiological interactions. By including a priori physiological information, it is possible to determine a model of the cardiovascular interactions, as shown in Figure 2(a). The model quantitatively describes the gain of mechanical action of HR on AP and neural action from AP to HR as well as the resonance of loops on AP, while respiration activity as an external input acts at the same time on HR and AP. The model approach allows a better interpretation of the relationships among the different signals, providing a more realistic estimate of the relevant parameters of clinical relevance, such as the baroreceptive gain, as shown in Figure 2(b) [2].
Time-Frequency and Time-Variant Methods for BiomedicaL Signal Processing
Many biomedical signals are characterized by specific rhythms that carry the relevant information about the underlying generating system. Typical examples are the d, i, a, and b rhythms of the electroencephalograph (EEG) and the low- and high-frequency components of the HRV signal. The frequency analysis of these oscillatory patterns is usually performed under the hypothesis of stationarity required by both nonparametric (based on Fourier transform) and parametric (based on modeling the signal-generating mechanism) approaches. However, biomedical signals are characterized by transient phenomena of various natures (i.e., they are intrinsically nonstationary), and, sometimes, the interest is precisely in the dynamic variations related to physiological or pathological events. The possibility of tracking spectral changes over time is now possible with the application of time-frequency and time-variant methods. The Department of Bioengineering at the Politecnico di Milano has been very active in this field and has contributed with both methodological innovations and novel applications.
An interesting field of application is the study of the relationship between the autonomic nervous system and myocardial ischemia, either spontaneous or induced. In the study of the vasovagal syncope, using a parametric time-variant model in the bivariate form, an autonomic mismatch between HR and AP regulation was observed before syncope.
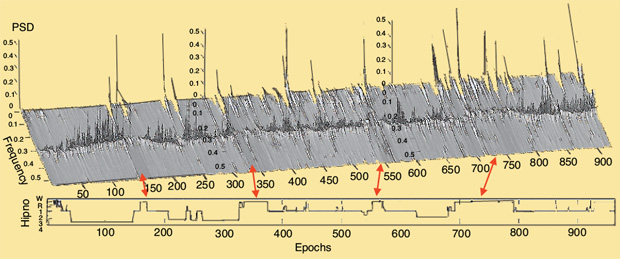
Another field of application utilizing these methodologies is the study of sleep [2]. Sleep is a physiological condition that is not uniform during the night but is characterized by different stages [rapid eye movement (REM) and non-REM from light to deep sleep]. Even if sleep evaluation is mainly based on the analysis of EEGs, it also affects the peripheral systems and the related signals, such as HRV and respiration. Thus, the typical parameters that quantify the dynamic changes of the HRV signal, i.e., low- and high-frequency powers, significantly change during different sleep stages and in the presence of pathological events. Figure 3 shows the time-variant HRV spectra obtained through an adaptive autoregressive (AR) model during sleep. The REM periods are clearly recognizable. This approach has led to the development of home monitoring systems based on wearable or smart devices and to fully automatic classification of sleep based on the HRV signal.
The Estimation of Cortical Activity and Functional Connectivity in Humans by Using Noninvasive Techniques
EEG processing also takes advantage of the application of time-frequency methodologies. It is well known that EEG rhythms are modulated by different brain functions. Alpha and beta event-related desynchronization (ERD) and synchronization (ERS) associated to movement planning, execution, and imagery are well-known phenomena that take place at the level of the central nervous system. Time-frequency analysis is thus well suited for this kind of application. The use of adaptive parametric models allows the tracking of not only the amplitude modulations of the EEG rhythms but also the frequency modulation related to movement execution.
In addition, parametric models are suited for multichannel analysis applied to the study of high-resolution EEGs. A series of techniques was developed in recent decades related to the estimation of cortical activity and functional connectivity from scalp EEG measurements by using realistic and average head geometry. The signal-processing methodologies employed in these attempts made use of complex functional brain representations that employ a huge number of cortical dipoles (between 5,000 and 7,000) as a source model. The estimation of the cortical activity from EEG data was also improved by using a priori information derived from other neuroimaging methodologies, such as magnetoencephalography and functional magnetic resonance imaging, which allowed the identification of precise spatial constraints.
The main brain functions were investigated, including movement, planning, execution, cognitive and attentive functions, learning processing, and responses to many different stimuli. Multichannel analysis allowed the estimation of the functional and effective connectivity among complex brain networks. However, the estimation of a connectivity pattern does not solve the problem of how to interpret and quantify such complex cortical networks. The solution to this problem was obtained by applying the graph theory methodology to the pattern estimated by classical approaches. Graph theory indexes synthesize and quantify the information related to the estimated patterns of functional connectivity while applying a time-varying version of algorithms that synthesize the behavior of the evolving cortical network.
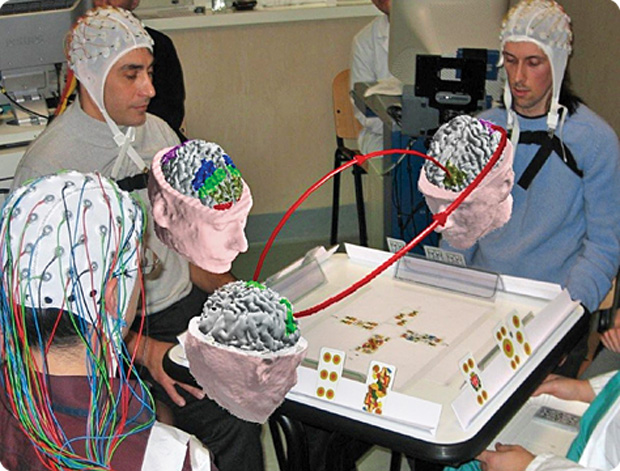
The latest methodological advancement is the extension of the connectivity analysis to the multisubject level, the so-called hyperconnectivity estimation. In this area of research, the standard methodologies were extended to generate a multisubject model that takes into account the EEG data coming from two or more persons attending the same cognitive task. The result of this application is a network of functional connectivity between different parts of the brain for a group of human subjects. An example of such an application is shown in Figure 4. Application, in this context, is directed toward the assessment of group behavior on the basis of multiple EEG measurements [4].
Brain-Computer Interfaces: Theory and Application in Neurorehabilitation
In the last 15 years, the continuous collaboration between bioengineers and clinicians has resulted in the achievement of important results and applications in several fields. One example is the brain–computer interface (BCI). Thanks to European and various national grants, there has been great progress in the development of a fully operational home environment that can be guided by the brain. Such an environment allows patients to guide their own wheelchairs, position beds, open and close doors, switch on lights, or switch off the television, all using a BCI. These applications take advantage of novel methodologies for the detection of a particular cerebral wave, named P300, which plays a critical role in the generation of the chain of command from the user to the final device to be driven. The quality of P300 recognition from the patient’s EEG signals was greatly improved by adapting processing to the needs of practical application, leading to a BCI system that works faster than average, based on several P300 responses.
BCI technologies have also been used with the aim of promoting neurorehabilitation for patients affected by stroke. Rehabilitation protocols based on BCI technologies demonstrated an increase in the rehabilitation performances of patients, while indexes related to the execution of particular rehabilitation exercises were able to predict the outcome of the rehabilitation process.
The Use of EEG Measurements for Estimation of Cortical Activity During Specific Tasks
One research area in signal processing revolves around quantifying EEG changes taking place in the brain during a series of professional work tasks. Of particular interest here is the application of real-time detection of the mental workload during a motor–cognitive task in categories of professional workers such as airline pilots and air traffic controllers. Other interesting applications include the evaluation of the impact of commercial advertising messages, while another new research area aims to evaluate the cortical activity and connectivity changes in people observing works of art. Experiments were held in several art galleries in Rome, Italy, in which EEG signals and HR were recorded in subjects viewing the paintings of Tiziano Vecellio and Jan Vermeer as well as in front of Michelangelo’s Moses sculpture.
Image Processing
In recent decades, imaging has acquired greater relevance in clinics, mainly thanks to the technological improvements that have resulted in high-quality images, reducing, at the same time, the invasiveness of procedures. In parallel, image processing has become one of the most important and promising fields of research, with a wide range of applications.
In cardiovascular surgery, the combined analysis and integration of the most advanced imaging techniques with advanced image processing and finite-element modeling has helped in obtaining patient-specific information and characterizing the in vivo behavior of the prosthetic valves and the effects of remodeling surgery on the left ventricle.
Imaging in Radiotherapy
Image processing has found many clinical applications in nuclear medicine. An important area of research is the resolution enhancement of PET through the use of statistical models of the typical blurring phenomena.
Modern radiotherapy (RT) approaches, typically based on advanced instrumentation like inverse modulation RT or helical tomotherapy (HT), are able to deliver high-dose conformity and homogeneity for complex tumor-target irradiation, while preserving organs close to the tumor that would otherwise be at risk. In the context of RT, the role of medical imaging has become increasingly important for the improvement and the verification of the RT treatment plan as well as for the evaluation of morphological and functional changes on the patient’s body induced by RT. In fact, these changes are strongly related not only to the efficacy of RT for cancer treatment but also to patient quality of life, which depends on reducing the side effects of the RT.
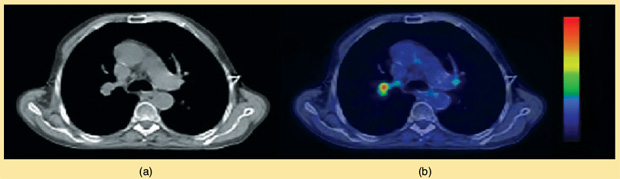
In the field of image processing in RT, Italian bioengineering research has dedicated much effort to developing and validating registration methods for the integration of multimodal medical images. In this context, rigid registration techniques based on external markers and the maximization of mutual information have been proposed for the integration of 18FDG PET images with CT images of the thorax and abdomen. The integrated images allowed a better definition of the RT treatment plan by including, in the target volume, the visible hyperintense PET areas corresponding to active lymph nodes involved in the neoplastic process related to non-small cell lung cancer in the thorax (Figure 5) or to pancreatic tumors in the abdomen.
More recently, automated deformable registration techniques have been proposed to recover patient spatial misalignments in different RT sessions and to track the anatomical modifications occurring in patient anatomy during radiation treatment. For example, nonlinear registration, based on the mutual information and a b-spline deformation model, has been proposed for the estimation of lung parenchyma modification during HT treatment for non-small cell lung cancer patients. The same deformable registration methodology has also been successfully applied in the study of head and neck cancer patients, where a significant decrease in parotid gland volume and its migration toward the midline of the patient is usually observed during RT. In this case, deformable registration has been proposed to quantitatively evaluate the parotid anatomical modification and to provide an automatic method for parotid contour propagations on serial CT studies. In the same area, other interesting research from Italian groups have looked at generating, using cone-beam CT images acquired during the RT session and deformable registration, a virtual CT and the associated segmentation of organs at risk and tumor target volume for adaptive RT.
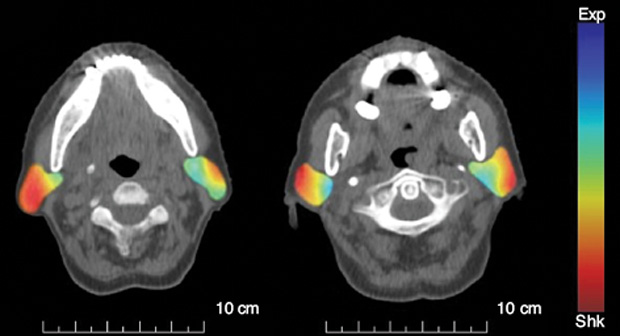
Besides image registration, recent novel methods have also been developed for the automatic extraction of biomarkers from imaging, useful both for the early identification of patients who can benefit from adaptive RT and for the quantification of tissue structural variations induced by RT and causing critical side effects. In this line of research, in the head and neck region, global parotid gland shrinkage, typically occurring at the end of RT treatment and known to be associated with the pathological condition of xerostomia, has been strongly related to the Jacobian of the deformation field (Figure 6) and to other tissue textural parameters (such as the mean intensity or fractal dimension [5]) extracted from CT images in an early phase of the RT treatment cycle.
Finally, in the last few years, great efforts have been dedicated to examining particle radiation therapy from different points of view, such as quantifying organ motion based on scale-invariant features or including PET imaging to verify the RT plan in ion beam RT.
Toward Multimodal, Multiorgan, and Multiscale Integration
In this article, we have provided a short overview and just a few examples of the different activities that Italian bioengineers are carrying on in the field of signal and image processing. It is a very broad field, and many avenues of research are underway, but signal and image processing is moving toward integration at different levels according to the paradigm of “multimodal, multiorgan, multiscale.”
Multimodal integration is intended to enhance the available information through the fusion of data coming from different sources: multiple-lead recordings in EEG and ECG, signals and images, anatomical and functional data, and different modalities of functional imaging. All these, when properly combined, contribute to a more complete and exhaustive view of many organs and biological systems and their functions.
Multiorgan integration and its conjunct analysis in a common framework can help better interpret observed phenomena, both in physiology and in clinics.
Finally, the multiscale approach aims to correlate information coming from organs or systems scaled to the cellular or even subcellular level, for example, associating genetic correlates to typical functional or anatomical patterns [2]. With this new direction, the future of image and signal processing in Italy promises to lead to even more precise and quantitative information.
References
- A. Malliani, Principles of Cardiovascular Neural Regulation in Health and Disease. New York: Springer-Verlag, 2000.
- S. Cerutti and C. Marchesi, Eds., Advanced Methods of Biomedical Signal Processing (IEEE Press Series in Biomedical Engineering, M. Akay, ser. Ed.). Hoboken, NJ: Wiley, 2011.
- Task Force of the European Society of Cardiology and the North American Society of Pacing and Electrophysiology, “Heart rate variability: Standards of measurement, physiological interpretation, and clinical use,” Circulation, vol. 93, no. 5, pp. 1043–1065, Mar. 1996.
- F. Babiloni and L. Astolfi, “Social neuroscience and hyperscanning techniques: Past, present and future,” Neurosci. Biobehav. Rev., vol. 44, pp. 76–93, 2014.
- E. Scalco, C. Fiorino, G. M. Cattaneo, G. Sanguineti, and G. Rizzo, “Texture analysis for the assessment of structural changes in parotid glands induced by radiotherapy,” Radiother. Oncol., vol. 109, no. 3, pp. 384–387, 2013.