The rate of doing work, expressed as the amount of work per unit—commonly measured in units such as watt or horsepower—is power in physics. It is the work–time rate or the energy released or transferred.
A previous “Retrospectroscope” note, published early in 2014, dealt with spirometry: it described many apparatuses used to measure the volume of inhaled and exhaled air that results from breathing [1]. Such machines, when adequately modified, are also able to measure the rate at which work is produced (specifically by an animal or a human being). Metabolism in that sense is the term used by physiologists and physicians, a word that in Greek, metabolismos, means “change” or “overthrow,” in the sense of breaking down material, as in burning some stuff.
Early Writings on Metabolism
The first documented reference to metabolism goes as far back as 1260 A.D. in a work titled The Treatise of Kamil on the Prophet’s Biography, by a physician named Ibn al-Nafis (b. Damascus, Syria, 1210 or 1213 A.D.; d. Cairo, Egypt, 1288 A.D.), where the following statement is found:
Both the body and its parts are in a continuous state of dissolution and nourishment, so they are inevitably undergoing permanent change.
Quite a statement, for it concisely, although perhaps somewhat crudely, describes what metabolism indeed is. The history of the scientific study of metabolism spans several centuries and has moved from examining whole animals in early studies to examining individual metabolic reactions in modern biochemistry.
In 1614, Santorio Santorio or Sanctorius (1561– 1636), an Italian physician, published the first controlled experiments in human metabolism in his book Ars de statica medicina (The Art of Static Medicine). He described how he weighed himself before and after eating, sleeping, working, having sex, fasting, drinking, and excreting and found that most of the food he took in was lost through what he called insensible perspiration. In these early studies, the mechanisms of these metabolic processes had not been identified, and a vital force was thought to animate living tissue. Only the studies of Louis Pasteur (1822–1895) and Friedrich Wöhler (1800–1882) in the 19th century recognized that organic compounds and chemical reactions found in cells are no different in principle from any other part of chemistry.
One of the most prolific of these modern biochemists was Hans Krebs (1900–1981), who made highly significant contributions to the study of metabolism. Other early researchers of respiration and metabolism were limited by the technology and knowledge current in their times. By the mid-1800s, however, many advances were made in the area of respiration and metabolism.
The origin of pulmonary function testing (PFT), for example, goes back to 1846, when John Hutchinson published his study on the “vital capacity” and demonstrated his new spirometer, which became a common instrument for physicians [1]. However, for every physician who advocated its use, usually another equally prestigious physician said it had little value. This attitude may have been partly due to conservatism; but, in reality, a decrease in, say, vital capacity is rather nonspecific and has a very limited value in diagnosing and monitoring lung diseases. For this reason, little advancement came about beyond Hutchinson’s original study.
How CO2 Absorbents Saved Pulmonary Testing from Obscurity
The next significant progress in PFT did not come from research in spirometry but from the study of metabolism and, just as important, the availability of a relatively simple chemical compound capable of removing the expired carbon dioxide (CO2) that otherwise led to a higher and shallower respiratory rate, thus upsetting the measurement.
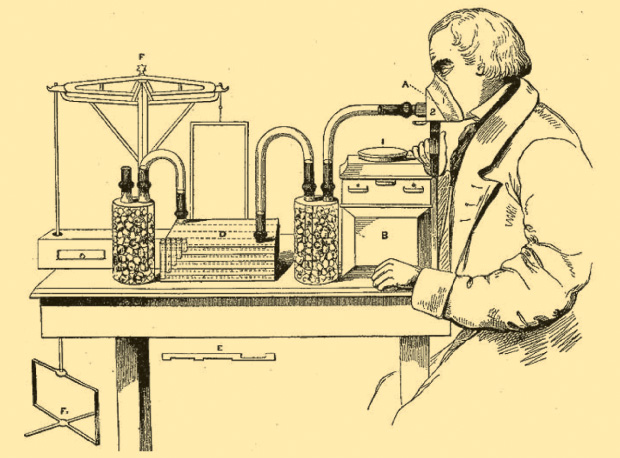
Edward Smith (1819–1874), a British physician and public health advocate, published in 1859 a seminal study on respiration, explaining how it reflected on metabolism and nutrition. In fact, Smith was not the first to recognize that CO2 could be chemically absorbed. His inspiration was that the chemicals used to absorb CO2 could be very precisely weighed before and after an experiment and that the change in weight allowed him to measure the volume of CO2 that had been exhaled [2], [3]. Figure 1 reproduces Smith’s illustration for his 1859 paper. He focused on measuring exhaled CO2 and scaled his system for humans. By using a gas meter, he measured the amount of air the subject was breathing and so determined the volume of exhaled CO2.
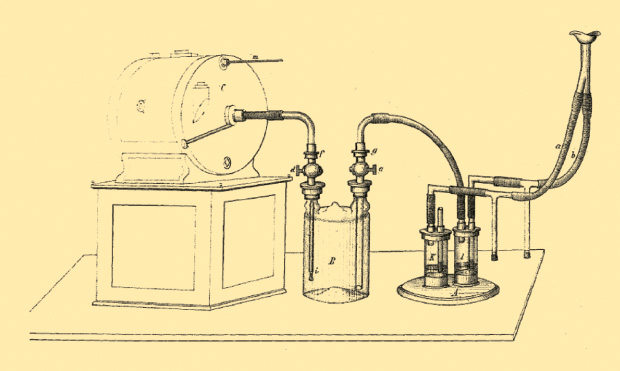
Max von Pettenkofer (1818–1901) and Carl von Voit (1831–1908), in turn, developed a smaller and simpler system. Figure 2 shows a mouthpiece attached to a pair of Müller valves. (The name refers to a company headquartered in Atlanta, Georgia, a manufacturer and distributor of hydrants, pipes, and valves.) The origins of the device go as far back as 1850. Exhaled air entered into a chamber containing caustic soda (potassium hydroxide), which absorbed the exhaled CO2; from there the air went to a precision gas meter. The CO2 absorbent was weighed after each experiment to determine how much CO2 was taken up, and the gas meter allowed the CO2 output per minute to be determined [4].
It should be noted that Max von Pettenkofer belonged to the scientific elite of the 19th century. With his dedicated and strict search for the laws of nature and his fight for scientific truth, he was a prototype of a modern researcher. Working with his close collaborator Carl von Voit, he was for many years the leader of the dominant school investigating metabolism. He acquired an authoritative position through the technical mastery with which he refined previously developed procedures.
We mentioned earlier that Edward Smith was not first to recognize possible CO2 absorption. In 1849–1850, Henri Victor Regnault (1810–1878) and Jules Reiset (1818–1896) developed a system for measuring both oxygen consumption and CO2 production in small animals. They measured CO2 by chemically absorbing it and measuring the change in weight. Their most significant innovation, however, was to design a sealed system. When the exhaled CO2 was absorbed, this lowered the pressure inside the system. They were then able to measure the amount of oxygen they needed to add to keep the pressure in the circuit stable and thereby to measure oxygen consumption. Although this approach was a significant milestone in the ability to measure respiration, subsequent researchers had difficulty scaling this system upward for use with humans [5]. Unfortunately, we could not find what absorbent Regnault and Reiset used.
Max von Pettenkofer continued Edward Smith’s work but on a much larger scale. He constructed a sealed room and used a watermill-powered pump to pull air through it. The air volume was carefully gauged by a gas meter, and a small sample was continuously streamed through an apparatus that absorbed CO2. Because the air volume was known, the weight of the absorbed CO2 could be converted to an actual CO2 volume.
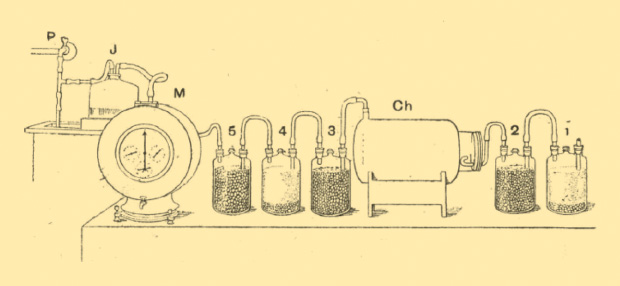
In the 1890s, there was a notable change in the chemicals used to measure respiration. Before this time, caustic soda and baryta water (barium hydroxide) were the commonly available chemicals used to remove CO2. These chemicals are difficult to handle, however, since they are both corrosive and toxic. In 1892, John Burdon Sanderson Haldane (1892–1964) developed an animal respiration apparatus that is the first known system to use soda lime (Figure 3). In his paper, Haldane included instructions on how to make and use granular soda lime. Such a substance (calcium hydroxide) absorbs CO2 and, although alkaline, is safe to handle without any excessive precautions.
It is not completely clear why soda lime was not the chosen compound for this purpose before this time. The reason may lie in the fact that, unlike caustic soda and baryta water, soda lime is a solid, not a liquid, and that, unless it is in granular form, it lacks effective absorption action due to lack of enough surface area [6].
Overview of Metabolimeters in the Period 1900–1930
![Figure 4: Wilber Atwater and Francis Benedict’s updated calorimeter. Abraham Lisk described this equipment [7].](https://www.embs.org/wp-content/uploads/2016/05/retrospectroscope04-2538484.jpg)
Wilbur Olin Atwater (1844–1907) collaborated extensively with his colleague Francis Gano Benedict (1870–1957) to develop the cycle ergometer in their studies on exercise metabolism. For more than 12 years, they conducted over 500 experiments concerning rest, exercise, and diet using respiration calorimetry. Atwater and Benedict soon brought to the scene a closed-circuit version of their metabolic chamber. Although smaller, like their original chamber, it was highly insulated and temperature controlled. It was similar in principle to Regnault and Reiset’s apparatus from 50 years earlier, but they used a pump to continuously move air from the chamber through a soda lime CO2 absorbent and then back into the chamber. Removing the soda lime canisters from the circuit at regular intervals and weighing them permitted measurement of CO2 production. Besides, by measuring the amount of oxygen needed to replace the CO2 that had been absorbed, they were able to measure oxygen uptake as well as CO2 production. This in turn allowed the respiratory quotient (the ratio between CO2 production and oxygen consumption) to be calculated (Figure 4) [7].
The need to switch canisters of soda lime in and out of the breathing circuit required measuring CO2 production over specific intervals, which were usually somewhat lengthy. George Oswin Higley, an instructor in chemistry at Michigan University from 1891 until 1905, developed a way to continuously monitor exhaled CO2 flow with a balance. A sketch of the device appears in Higley’s dissertation [8]. The balance-type apparatus has an absorbing unit and a counterpoise. With weights on one side beaker, a lever point deflected upward and downward on a drum, thus indicating the CO2 absorbed.
Following his experience with calorimeter chambers, Francis Benedict produced a closed-circuit breathing system. As with the previous instrument, air was circulated by a blower, while CO2 was absorbed by soda lime canisters that were weighed to determine the rate of CO2 production. In addition, a spirometer helped keep the volume of the circuit at the same level and allowed the continuous measurement of the subject’s tidal volume, minute volume, and oxygen consumption.
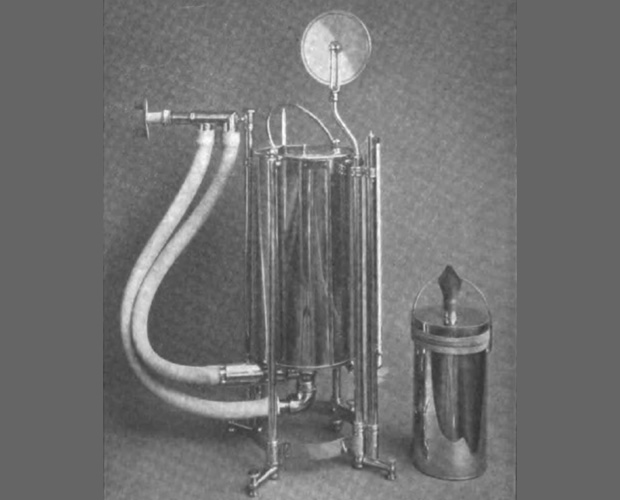
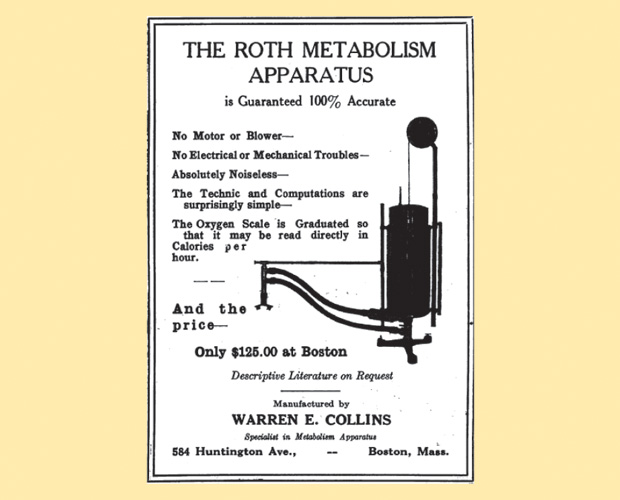
By this time, it had become evident that oxygen consumption alone was the primary indicator of metabolism, so simpler testing systems were developed. Closed-circuit systems were filled with oxygen instead of room air, and CO2 absorbents stopped being used to measure CO2 production. To absorb the latter gas was important; the rate at which oxygen disappeared was proportional to a subject’s oxygen consumption, while the resting oxygen consumption defined the basal metabolic rate (BMR) (Figure 5) [9]. Paul Roth, a close collaborator of Francis Benedict in Boston, updated a previous design, as depicted in Figure 6. Basal metabolism testing became rather popular, and several companies decided to enter the market solely for the purpose of manufacturing and selling metabolic measurement systems to hospitals and physicians. It became a good business.
![Figure 5: Benedict’s portable respiration apparatus, a closed-circuit system for measuring oxygen consumption. Air was circulated from the mouthpiece through an oxygen-filled spirometer. A soda lime canister inside the spirometer absorbed exhaled CO2 [9].](https://www.embs.org/wp-content/uploads/2016/05/fig52.jpg)
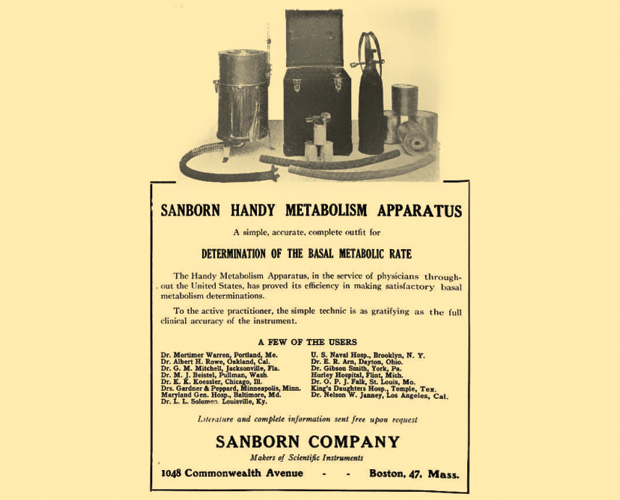
From there on, the number of similar machines, showing relatively minor improvements, proliferated rapidly. Let us quickly review some of them, as such equipment often appeared in medical journals as advertisements. Figures 7 and 8 are good examples from the 1920s. These manufacturers—including Collins, Sanborn, McKesson, and Jones—continued to manufacture metabolic systems for decades and also played a significant role in producing spirometers and other pulmonary testing systems [10], [11]. Another example of such an instrument is the McKesson Metabolor, which used a variation of a Krogh-type spirometer [12].
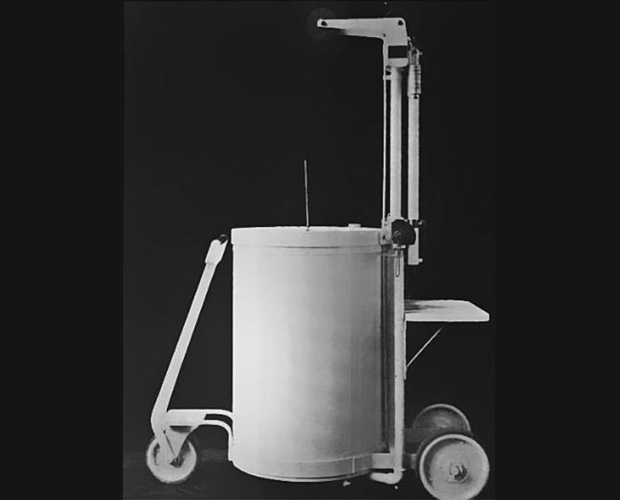
Jules Tissot (1870–1950) was a French biologist of brilliant scientific ancestry: he studied and worked with no less than the great Auguste Chauveau (1827–1917) and in 1920 succeeded another giant, Louis Lapicque (1866–1952), as chair professor of physiology in Paris. A superb experimenter, he perfected several laboratory instruments, especially ones related to respiratory function. It was through this that he came up with a closed-circuit spirometer now known as the Tissot spirometer, whose primary innovation was its ability to measure large volumes of air with a great deal of precision. This permitted collecting a patient’s exhaled air over a prolonged period and then analyzing it for CO2 and oxygen (Figure 9) [13]. The Tissot spirometer was large, heavy, and not well suited for field measurements, but some design improvements allowed it to be brought to the patient instead of the patient to the spirometer, as shown in Figure 10.
![Figure 9: The Tissot spirometer used for basal metabolism measurements [13].](https://www.embs.org/wp-content/uploads/2016/05/retrospectroscope09-2538484.jpg)
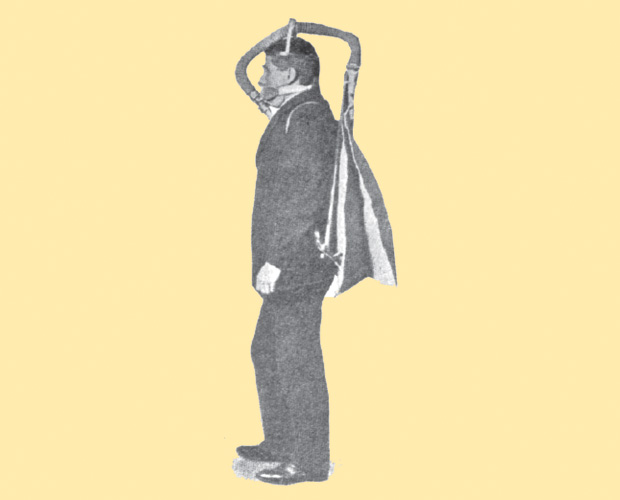
Claude Gordon Douglas (1882–1963), also of outstanding academic ancestry, significantly advanced respiratory measurements in moving subjects. In 1904, he started working for the research degree of B.Sc. under the supervision of J.B.S. Haldane, completing his medical degree in 1907. He quickly became the best-known and the most permanent of the younger colleagues of Haldane, whose work since the turn of the 20th century had transformed the subject of respiration. During this period, Douglas began to measure the rate of oxygen uptake and CO2 output by collecting expired air in a large canvas gas bag, the Douglas bag, which became well known due to its convenience for measuring energy expenditure in people in various occupations (Figure 11).
BMR to PFT
With the ready availability of the techniques and equipment to measure basal metabolism, hundreds of researchers undertook studies on humans and animals involving an inordinately wide variety of diets, activities, ages, ethnicities, climates, temperatures, diseases, and medications. Basal metabolism became a method to diagnose and monitor diseases and was a common clinical test for decades.
By the 1920s, basal metabolism systems that were able to measure oxygen uptake and CO2 production were reevaluated to measure these values during exercise. In the 1930s, researchers also found that they could use opencircuit gas collection systems, this time to determine volumes by nitrogen washout. During the 1930s and 1940s, closed-circuit basal metabolism systems, with only minor modifications, became common in measuring lung volumes, first by hydrogen dilution and later by helium dilution.
Basal metabolism no doubt laid the groundwork for the modern field of PFT, and by the 1950s many of the manufacturers of BMR equipment that started in the 1920s were selling PFT systems as well. An online medical dictionary defines PFT as “a group of procedures that measure the function of the lungs, revealing problems in the way a patient breathes.” Basal metabolism is still a subject of research and, along with spirometry, may be one of those procedures; however, only a more limited number of circumstances and conditions tend to restrict BMR clinical use. Nonetheless, it was an important step along the way for medical knowledge. So, at this point, let us refresh a few concepts.
Some Essential Concepts
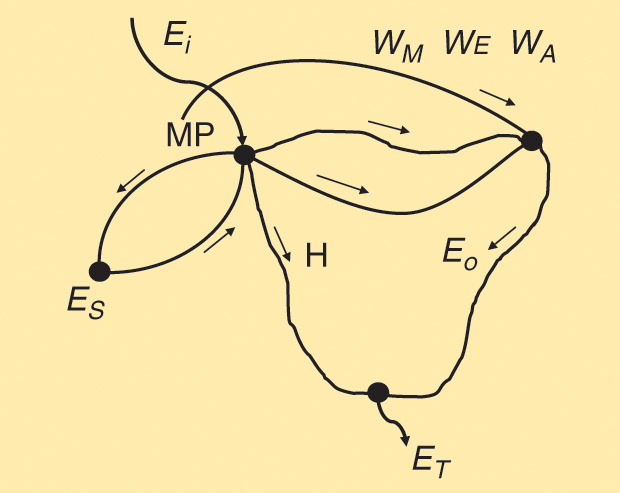
Figure 12 depicts the energy flow diagram in, say, a mammalian species. There is a relatively small and dynamic metabolic pool (MP) in the body fluids (shown as a node), which receives the energy input Ei, obviously coming from the ingested food. Such a pool varies with time and exchanges energy with the energy reserves ES (located in the liver, adipose tissue, muscle stores, and blood). Glucose is a good and versatile example. On the right hand, a second node represents the sum of muscular energy WM, the energy WE spent in excretion processes, and the energy WA used in absorption mechanisms. All these result in the energy output Eo, which represents the useful part. Ultimately, it becomes thermal energy. Chemical reactions in the MP produce a significant amount of heat H, as indicated in the branch from MP to the lower node. Finally, the total energy released ET = Eo + H appears as the sum of those two converging paths.
The exchange between the MP and the reserves ES is a two-way path—say, energy uptake EU and energy release ER—so that at the node MP, we can write,
Ei = Eo + H + EU– ER.
This equation is nothing but the basic Law of Conservation of Energy, established by Julius Robert von Mayer (1814–1878) and independently by Hermann von Helmholtz (1821–1894), both in Germany— and again independently by James Prescott Joule (1818– 1889) in England, and on his own too by Ludwig August Colding (1815–1888) in Denmark. As sometimes unfortunately happens, the scientific community largely neglected Colding’s work. However, it was Benjamin Thomson (1753–1814), Count Rumford of Bavaria, who in 1798 first noticed that the mechanical work expended in the process of boring a cannon related to the production of heat. Thomson viewed the process as merely a transformation of energy from one form to another, the total energy being conserved. Due to the experimental work of Joule, it is now known that 1 kcal = 4,187 joules.
When Ei = Eo = EU= 0—that is, when the subject is fasting (no energy uptake) and at rest—the diagram in Figure 12 simplifies to the pathway ES releasing energy ER to MP–H–ET, so that the organism only produces heat, and that heat is called the BMR. Because the power capacity of an animal depends on size, the BMR is usually expressed in kcal/hour × m2. There are other ways to do this—for example, as a percentage above (+) or below (-) the normal level, which in humans is accepted as 40 kcal/ hour × m2. Hence, a determination of 30 kcal/hour × m2 would become –25%, while one of 50 kcal/hour × m2 would be +25%. The normal variation of the BMR is ±15%, i.e., as any biological phenomenon relatively large.
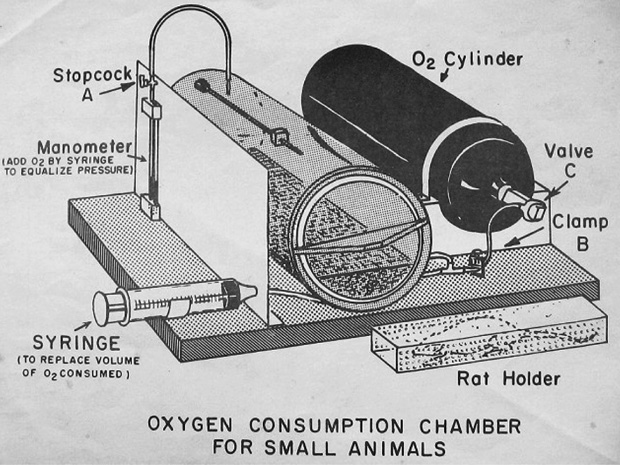
When author M. Valentinuzzi was a graduate student at Baylor College of Medicine, in Houston, Texas, during the 1960s, the metabolic chamber depicted in Figure 13 was used in regular experimental exercises. Later on, during the 1970s, a similar chamber was built at the Laboratory of Bioengineering of the University of Tucumán. The holder contained the test rat (other species were also employed), while a small cylinder stored oxygen. The manometer indicated the decrease in pressure as the animal breathed, and the lateral syringe replaced the volume of oxygen consumed. Volumes and pressures needed conversion to standard conditions (STP) to compare values. A couple of studies were carried out on small caimans using this equipment [14], [15]. More recently, respirometric measurements on subterranean rodents (tucu-tucus) brought to light many unknowns [16]. The latter authors measured rates of O2 consumption by open-flow respirometry and with the Field Metabolic System from Sable Systems of Las Vegas, Nevada.
The up-and-down short jump depicted in Figure 14 represents the old and well-known Harvard Step Test [17]. Say that Big John wants to lose 100 g of fat just by doing the test. He needs to know how many full jumps would accomplish his objective. His weight is Wt = 71.4 kg, and the height of the bench is h = 0.5 m; he will exercise at a rate of 30 jumps/min.
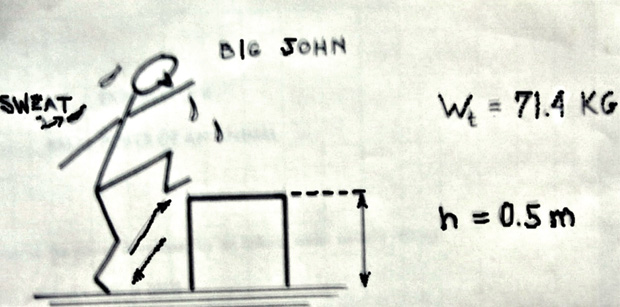
The energy to be consumed EC must be equated with the work to do, and since 1 g of fat requires 9 kcal and Big John tries to burn 100 g, he will have to work out until reaching such a value. Thus, 900 kcal = Wt × h × N, where N is the number of full jumps, but 1 kcal = 4,187 joules, leading to 900 × 4,187 = 3,768,300 joules, so that N = 3,768,300 joules/Wt × h = 10,800 full jumps, which at the rate suggested above would need about three hours. Quite a sweat!
And just to close this note, let us examine Figure 15, which displays two amateur athletes, one exhibiting a superb muscular body, as he lifts weights every day (Big Guy John), and the other a young woman (Fabi Gal), who each morning jogs in the neighborhood park. Say that both consume the same number of calories in a given time. Does this metabolic value tell us something about the physiological and health differences between them, if any?

We hope this quick overview is helpful for the student, the general reader, and any interested researcher.
Acknowledgments
The images in this article are courtesy of Richard Johnston. The drawings are by Gustavo Idemi, San Juan City, West Argentina, our professional and kind collaborator.
References
- M. E. Valentinuzzi and R. Johnston, “ Spirometry: A historical gallery up to 1905,” IEEE Pulse, vol. 5, no. 1, pp. 73–76, Jan.–Feb. 2014.
- E. Smith, “Experimental inquiries into the chemical and other phenomena of respiration and their modification by various physical agencies,” Philosoph. Trans. Roy. Soc. London, vol. 149, pp. 681–714, 1859.
- K. Carpenter, “Edward Smith (1819– 1874),” J. Nutrition, vol. 121, no. 10, pp. 1515–1521, Oct. 1991.
- M. Pettenkofer and C. Voit, “Untersuchungen über den stoffverbrauch des normalen menschen” (in German: “Investigations on the material consumption of normal people”), Zeitschrift für Biologie, vol. 2, pp. 489–494, 1866.
- H. V. Regnault and J. Reiset, “Chemische untersuchungen über die respiration der thiere aus verschiedenen klassen” (in German: “Chemical investigations on animal respiration of different classes”), Justus Liebigs Annalen der Chemie, vol. 73, no. 3, pp. 257–321, 1850. Previously published in French in Annales de Chimie et Physic, Série III, vol. XXVI, 1849, Paris.
- J. B. Haldane, “A new form of apparatus for measuring the respiratory exchange of animals,” J. Physiol., vol. 13, no. 5, pp. 419–430, July 1892.
- G. Lusk, “A respiration calorimeter for the study of disease,” in Clinical Calorimetry. New York: Russell Sage Institute of Pathology, 1915, p. 24.
- G. O. Higley, “A balance chemograph and the excretion of carbon dioxide during rest and work,” Ph.D. dissertation, Univ. Mich., 1905.
- F. B. Sanborn, ed., Basal Metabolism: Its Determination and Application, with original papers by C. G. Beall, J. E. Else, E. L. Gardner, H. D. Haskixs, C. E. James, L. Langstroth, R. C. Lewis, H. E. Marks, and J. W. Moore. Boston, MA: Sanborn Co. Publishers, 1922, p. 81.
- P. Roth, “Clinical observation with Benedict’s new portable respiration apparatus,” Boston Med. Surg. J., vol. 184, pp. 222–230, 3 Mar. 1921.
- P. Roth, “Modifications of apparatus and improved technic adaptable to the Benedict type of respiration apparatus,” Boston Med. Surg. J., vol. 186, pp. 491–498, 13 Apr. 1922.
- O. A. Brines, “Determination of the metabolic rate using the McKesson Metabolor,” Int. J. Surg., vol. 34, pp. 260, 1921.
- M. E. Abbott, “The determination of basal metabolism by the respiratory valve and spirometer method of indirect calorimetry with an observation on a case of polycythemia with splenomegaly,” Can. Med. Assoc. J., vol. 8, no. 6, pp. 491–509, June 1918.
- S. E. Huggins, H. E. Hoff, and M. E. Valentinuzzi, “Oxygen consumption of small caimans under basal conditions,” Physiol. Biochem. Zool., vol. 44, no. 1, pp. 40–47, Jan. 1971.
- S. E. Huggins, M. E. Valentinuzzi, and H. E. Hoff, “Relationship of oxygen consumption to heart rate and respiratory parameters in Caiman sclerops,” Physiol. Biochem. Zool., vol. 44, no. 2, pp. 98–111, Apr. 1971.
- P. Tachinardi, Ø. Tøien, V. S. Valentinuzzi, C. L. Buck, and G. A. Oda, “Nocturnal to diurnal switches with spontaneous suppression of wheelrunning behavior in a subterranean rodent,” PLOS, 13 Oct. 2015.
- J. R. Gallagher and L. Brouha, “A simple method of evaluating fitness in boys: The step test,” Yale J. Biol. Med., vol. 15, no. 6, pp. 769–779, July 1943.