Imaging is a crucial tool in medicine and biomedical research. Magnetic resonance imaging (MRI), computational tomography (CT), proton emission tomography (PET), and ultrasound are routinely used not only to diagnose disease but also to plan and guide surgical interventions, track disease progression, measure the response of the body to treatment, and understand how genetic and environmental factors relate to anatomical and functional phenotypes.
Medical images represent rich and complex anatomical and/or functional information. Tomographic modalities such as MRI, CT, PET, and three-dimensional (3-D) ultrasound generate 3-D in vivo images of the body, often with time as the fourth dimension. Moreover, in MRI, it is common to obtain multiple scans with different acquisition parameters during the same scanning session, encoding various tissue properties. For example, in brain MRI, T1-weighted scans are excellent for visualizing contrasts between brain gray matter and white matter while fluid-attenuated inversion recovery (FLAIR) scans are useful for visualizing white matter lesions.
Visual inspection by a radiologist is the most common way that medical images are interpreted. Increasingly, medical images are used to extract precise, quantitative measures, in which image information is reduced to a set of task-dependent numerical measures, such as volume, thickness, or entropy. For example, in the emerging field of breast cancer radiomics, MRI is being used to estimate the risk of tumor recurrence in individual patients. Quantitative indices that combine measures of tumor size and shape, intensity heterogeneity, and the dynamics of contrast agent uptake are input into a statistical model that assigns a patient an individual risk of tumor recurrence and helps the oncologist decide on the optimal treatment strategy for that patient [1], [5], [8].
To derive such quantitative measures from medical images requires that the structures of interest (e.g., tumors, in the previous example) be identified and outlined in 3-D. This process is known as the problem of image segmentation. In general, such segmentation is a very challenging and domain-specific problem. While some structures have clear and obvious boundaries with surrounding tissues, there is most often uncertainty about the location of some parts of the boundary—uncertainty that requires understanding of the anatomical context to resolve.
Because each segmentation problem in the human body presents different challenges, there is no single strategy for fully automatic segmentation. In some applications, statistical modeling and machine- learning algorithms are effective. In others, algorithms based on warping an image to a set of expert- labeled normative atlas images work best [7]. In still others, geometrically deformable models that learn variability in the shape of the structure of interest are most effective [6].
All of these algorithms require considerable training data—in the form of expert-labeled imaging data sets. Most important, in most segmentation problems relevant to clinical practice, particularly those involving pathology, fully automatic segmentation algorithms are years away from being as accurate and reliable as manual segmentation by an expert. For years to come, we expect that the needs of quantitative image analysis will continue to be largely met by means of interactive, expert-driven image segmentation.
ITK-SNAP Vision
![Figure 1: The main ITK-SNAP window in the course of brain tumor segmentation from a multimodality MRI data set. The user interface includes 2-D and 3-D visualization of the image data set and segmentation. The segmentation of the tumor and edema illustrated in this figure was generated using the semiautomatic segmentation mode in about 15 min. (Tumor image data are from the Medical Image Computing and Computer Assisted Intervention 2013 Multimodal Brain Tumor Segmentation (BRATS) challenge [11]. Tumor image data publicly available from the ITK-SNAP web page, http:// www.itksnap.org.)](https://www.embs.org/wp-content/uploads/2017/07/yushkevich01-2701493.png)
To meet this need across a range of application domains and imaging modalities, we have developed the in teractive software tool ITK-SNAP for medical image segmentation. ITK-SNAP provides an environment for visualizing complex 3-D and four-dimensional (4-D) imaging data sets, coupled with a set of tools for the efficient, reliable labeling of structures of interest. The visualization environment offers linked visualization of two-dimensional (2-D) image cross sections and 3-D surface representations to aid spatial navigation of 3-D images. In addition to basic manual tools for outlining anatomy, ITK-SNAP provides computer- assisted tools that allow the expert to focus on the big-picture anatomical decisions during segmentation, while delegating the repetitive aspects of segmentation to the computer (Figure 1).
The ITK-SNAP design philosophy is that the tool should be easy to learn and suitable to as many application domains as possible. Under this philosophy, the tool’s features are carefully curated, and features that are specifically tailored to any particular application domain are omitted. ITK-SNAP is an open-source application written in C++, with precompiled binaries available for Windows, Linux, and MacOS. ITK-SNAP can read and write a variety of commonly used 3-D image formats. It has built-in support for reading data in Digital Imaging and Communications in Medicine (or DICOM), the industry standard for medical imaging data storage.
Experience based on multiple hands-on training courses has demonstrated that the most important ITK-SNAP features can be mastered during a two-hour training session.
Support for Multimodality Image Data Sets
A particular strength of ITK-SNAP is the support for working with multiple image data sets simultaneously, even if these data sets are of different resolution, orientation, or imaging modality. For example, ITK-SNAP can load and segment T1-weighted and FLAIR scans from a single MRI session or CT and MRI scans of a patient obtained on different days. In addition, 4-D data sets, such as 4-D ultrasound or dynamic cardiac MRI, can be visualized, as can multicomponent images, such as principal water-diffusion direction maps derived from diffusion-weighted MRI.
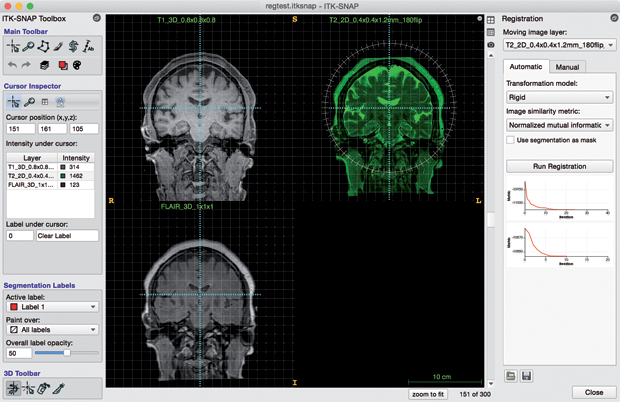
ITK-SNAP provides built-in manual and automatic registration modules that can be used to align scans to, for example, account for patient positioning and motion (Figure 2). Once multiple image data sets are loaded into ITK-SNAP, multimodal information from all of them can be used jointly for interactive segmentation.
Semiautomatic Segmentation with Supervised Learning and Level Sets
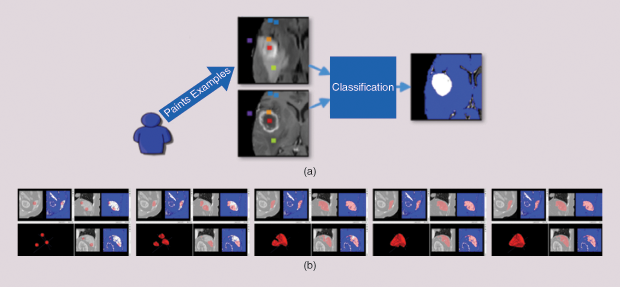
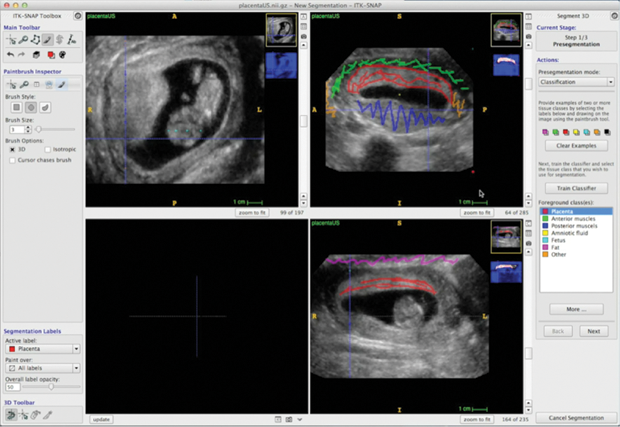
The ITK-SNAP semiautomatic segmentation pipeline allows users to efficiently segment anatomical structures in multimodality images. The pipeline consists of two stages. In the first, the user combines information from multiple images into a single foreground/background probability map by training a supervised random forests machine-learning algorithm [2], [4]. The user paints samples of the different classes of tissue in the image and designates these classes as either foreground or background (Figure 3).
For example, when segmenting a brain tumor, necrotic tissue, enhancing tumor core, and edema may constitute foreground classes, while healthy brain white and gray matter and cerebrospinal fluid constitute the background classes. The machine-learning algorithm uses these training data to assign each location in the image domain a foreground or background probability. In some problems, not all of the image locations labeled as foreground constitute the object of interest: for instance, the image may contain multiple tumors, but the user is interested in segmenting a particular tumor.
In the second stage, the user initializes a deformable contour inside of the structure of interest, and the contour evolves, automatically fitting itself to the detailed 3-D boundary of the foreground region, while maintaining a smooth surface [3], [9], [10]. This process replaces conventional, tedious manual 3-D tracing (which often takes hours and is known to be unreliable) with computer-assisted segmentation that requires only minutes or even seconds.
Tools for Editing Segmentations
As automated segmentation in challenging data may still include errors, ITK-SNAP provides tools for manually editing the segmentations produced using the semiautomatic method (or, alternatively, for generating a manual segmentation from scratch) (Figure 4). These tools include 2-D outlining and paintbrush tools and 3-D mesh editing tools, such as the 3-D scalpel. To speed up manual segmentation of large structures, ITK-SNAP includes an interpolation module that allows the user to trace a structure in just a handful of slices, with the algorithm filling in the intermediate slices. To facilitate collaborative segmentation, ITK-SNAP provides annotation tools so that users can make notes and indicate corrections directly on top of segmentations, similar to PDF commenting tools. Finally, ITK-SNAP can generate reports on the volume and intensity characteristics of segmented structures to be used for quantitative and statistical analysis.
Acknowledgments
Dozens of developers have contributed to ITK-SNAP over the past two decades. ITK-SNAP development is supported by the National Institutes of Health/National Institute of Biomedical Imaging and Bioengineering grant R01 EB014146.
References
- A. B. Ashraf, S. C. Gavenonis, D. Daye, C. Mies, M. A. Rosen, and D. Kontos, “A multichannel Markov random field framework for tumor segmentation with an application to classification of gene expression-based breast cancer recurrence risk,” IEEE Trans. Med. Imag., vol. 32, no. 4, pp. 637–648, Apr. 2013.
- L. Breiman, “Random Forests,” Mach. Learning, vol. 45, no. 1, pp. 5–32, 2001.
- V. Caselles, R. Kimmel, and G. Sapiro, “Geodesic active contours,” Int. J. Comput. Vision, vol. 22, no. 1, pp. 61–79, 1997.
- A. Criminisi, J. Shotton, and E. Konukoglu, “Decision forests: A unified framework for classification, regression, density estimation, manifold learning and semi-supervised learning,” Found. Trends Comput. Graph. Vision, vol. 7, no. 2–3, pp. 81–227, 2012.
- M. R. Harowicz, T. J. Robinson, M. A. Dinan, A. Saha, J. R. Marks, P. K. Marcom, and M. A. Mazurowski, “Algorithms for prediction of the Oncotype DX recurrence score using clinicopathologic data: A review and comparison using an independent dataset,” Breast Cancer Res. Treat., vol. 162, no. 1, pp 1–10, Jan. 2017.
- T. Heimann and H.-P. Meinzer, “Statistical shape models for 3D medical image segmentation: A review,” Med. Image Anal., vol. 13, no. 4, pp. 543–563, Aug. 2009.
- J. Eugenio Iglesias and M. R. Sabuncu, “Multi-atlas segmentation of biomedical images: A survey,” Med. Image Anal., vol. 24, no. 1, pp. 205 –219, Aug. 2015.
- H. Li, Y. Zhu, E. S. Burnside, K. Drukker, K. A. Hoadley, C. Fan, S. D. Conzen, G. J. Whitman, E. J. Sutton, J. M. Net, M. Ganott, E. Huang, E. A. Morris, C. M. Perou, Y. Ji, and M. L. Giger, “MR imaging radiomics signatures for predicting the risk of breast cancer recurrence as given by research versions of mammaprint, oncotype dx, and pam50 gene assays,” Radiology, vol. 281, no. 2, pp. 382–391, Nov. 2016.
- J. A. Sethian, Level Set Methods and Fast Marching Methods. Cambridge, U.K.: Cambridge Univ. Press, 1999.
- S. Zhu and A. Yuille, “Region competition: Unifying snakes, region growing, and Bayes/MDL for multi-band image segmentation,” in Proc. Int. Conf. Computer Vision (ICCV’95), 1995, pp. 416–423.
- B. H. Menze, A. Jakab, S. Bauer, J. Kalpathy-Cramer, K. Farahani, J. Kirby, Y. Burren, N. Porz, J. Slotboom, R. Wiest, and L. Lanczi, “The multimodal brain tumor image segmentation benchmark (BRATS),” IEEE Trans. Med. Imag., vol. 34, no. 10, pp.1993–2024, 2015.