
The gut microbiome is a key contributor to human health, but untangling how this happens is still a challenge. Bioinformatics, software, and machine learning could help
The microbiome has a prominent impact on human health, but with microbiomes each comprising trillions of microorganisms such as bacteria, viruses, protozoa, and fungi, and microbes differing from one person to another, much is left to learn. That includes everything from identifying the microbiota present to also deciphering their behavioral roles in human health and disease.
For researchers trying to make sense of it all, such a task can be daunting, according to Binhua “Julie” Ling, M.D., Ph.D., associate professor and co-lead of the Host-Pathogen Interactions Research Program at Texas Biomedical Research Institute (Figure 1). “It can be particularly challenging for a basic research scientist to analyze the data and get those connections (between microbiome and host health), because you need bioinformatics expertise to do that,” she said.

Figure 1. Binhua “Julie” Ling and her group at the Host-Pathogen Interactions Research Program at Texas Biomedical Research Institute (Texas Biomed) have developed an open-source tool, called the MTD, that allows the simultaneous analysis of gene expression in microbiome and in the host to find correlations between microbiota and health or disease. Ling sees MTD as especially helpful to basic research groups, because it is simple to use and barely requires bioinformatics expertise. (Photo courtesy of Texas Biomed.)
Ling’s own basic-science group was seeking to analyze RNA sequencing data while studying simian immunodeficiency virus (SIV) in nonhuman primates, a similar virus to HIV in humans, but was struggling to find a tool capable of analyzing associations between the gut microbiome and disease simultaneously. Fortunately, the group was able to create a software tool of its own that can identify activated microbiota and host gene expression in a subject within the same sample, therefore uncovering microbiota, host genes, and pathways that potentially play important roles in health. “It is simple and user-friendly, and no bioinformatics background is required (to operate it),” Ling said. “That was the point. We developed this for basic research scientists and others who are interested in host-pathogen interaction research.”
Additional researchers are also working on improvements to microbiome analysis. One novel method comes from the group of Qiyun Zhu, Ph.D., assistant professor at Arizona State University’s Biodesign Center for Fundamental and Applied Microbiology, and the School of Life Sciences (Figure 2). He and his group detoured from the traditional method of amplifying and examining a microbe’s 16S rRNA gene to find its place—often to genus level—within traditional taxonomical classification. Instead, they used machine learning to run a microbe’s full genome through existing genomic databases, and rather than identifying microbes to taxon, they find matching, biologically relevant sequences. In so doing, he asserts, they can define the identity of microbiota much more finely and accurately.

Figure 2. Qiyun Zhu and his group at Arizona State University’s Biodesign Center for Fundamental and Applied Microbiology, have developed an open-source microbiome-analysis strategy that runs a sample microbe’s full genome through existing genomic databases, but instead of relying on classic taxonomic identifications, focuses on biologically relevant sequences. This strategy is designed to identity microbiota much more finely and accurately. (Photo courtesy of Qiyun Zhu.)
Results of initial tests of Zhu’s approach, which his group has dubbed the Operational Genomics Units (OGUs) method, show that it bests the traditional approach, albeit slightly, and his group is continuing to refine the OGU method to boost its performance further. Both Ling’s and Zhu’s software and instructions for its use are available online.
Free, simple, and online analytics
Ling has been studying AIDS-like disease in monkeys for more than two decades, and because HIV/SIV first targets the immune cells of the gastrointestinal tract, she and her group recently began investigating gut microbiota before, during, and after treatment with antiviral drugs similar to those used to treat humans with HIV [1].
Particularly, they were interested in tracking the synchronization of gene expression in the gut microbiome and in the host, but this type of side-by-side analysis wasn’t available to them. When her wet lab had a bit of a lull, partly due to the pandemic, Ling’s group began exploring the possibility of generating their own analytic tool for this purpose. One member of the group, then-graduate student Fei Wu (now Ph.D.), had taken courses in bioinformatics (Figure 3), and was able to spearhead the development of a software tool with suggestions along the way from Ling’s collaborator Yao-Zhong Liu, Ph.D., associate professor in the Tulane University School of Public Health and Tropical Medicine.

Figure 3. Ling credits then-graduate student Fei Wu, now Ph.D., (pictured) with spearheading the development of MTD. (Photo courtesy of the Ling Research Group.)
The researchers constructed a working software tool, now named the meta-transcriptome detector (MTD), that simultaneously analyzes RNA sequences of both the host and the microbiota from the same sample and singles out associations between the two [2]. MTD links and builds on existing software packages, and draws data from publicly-available RNA-sequence databases, while also allowing users to update the database with their own target RNA sequences. MTD output is an easy-to-read chart with color coding to show concurrent upregulation of gene expression in microbes and the host (Figure 4).
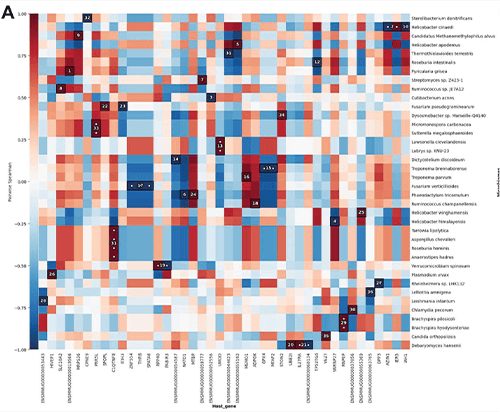
Figure 4. MTD automatically generates a graphic (shown here) that identifies up- or downregulation of pathways in the host and in microbes. Darker red shows a stronger positive correlation, meaning the upregulation or downregulation of a certain host gene or pathway is related to upregulation or downregulation of a certain type of microbe in the same direction. Darker blue shows a stronger negative correlation, meaning a host gene or pathway is less active but the microbe species is more active. Such information can help researchers find microbes of interest and possibly pathways that can be targeted for downstream investigation of mechanisms or treatment development. (Image courtesy of Texas Biomed.)
Tests showed that MTD performed well, so the group put it online (github.com/FEI38750/MTD) and made it freely available to other researchers. “We have provided all the details about installation of the software, and how to set up your primary Excel file. You just type one line of code, which is also described in the instructions, and the results and figures are all generated automatically,” Ling said.
Ling hopes that researchers can use it to discover new disease-related microbiota, obtain a clearer picture of host and pathogen interactions for further studies of cause-and-effect mechanisms, and target specific pathogens of interest to investigate relevant host gene regulation and signaling pathways. She especially envisions MTD expanding microbiome analytics for basic researchers, including her own group. She remarked, “We were motivated to develop this software because we are basic scientists too, so we needed it.”
No-taxonomy strategy
In the ASU approach, Zhu’s group switched to sequences rather than classic taxonomical classification for two main reasons. One is that classic taxonomy provides a false sense of security in identification, he said. “People rely on these scientific names to describe the grouping scenarios of organisms, while their actual fundamental nature, which is the DNA sequence of the genome, becomes something hidden underneath the surface.”
The other reason is that DNA sequences provide a much more precise view of evolutionary relationships not based on what he called “artificial hierarchies,” and therefore produce a highly detailed and unambiguous phylogenetic tree, he said. “With DNA data exploding as it is now, we have an imperative need for that higher level of granularity.”
Once he and his group had the central idea [3] of bypassing taxonomy in favor of individual genomes and the DNA sequences, which they call operational genomic units (OGUs), they worked with colleagues at multiple universities and research centers to build a bioinformatics analysis strategy that includes an open-source tool, called Woltka (available online at github.com/qiyunzhu/woltka), to handle the analysis. “What happens basically is you are trying to match your sequences to a database that contains many thousands of existing sequences from known genome sources, and Woltka has an alignment component that can say that your sequence may be from a certain genome,” Zhu explained.
Sometimes, a single sequence is not enough to narrow down the matching genome, but Woltka is able to look at multiple sequences at once and provide a consensus assignment to one genome. On those occasions when the sample is not a definitive match to one reference genome, Zhu said, “Woltka can simply output multiple matching genomes, each of which is normalized.”
The output from Woltka appears in a table. Each row is a genome, and each column is a sample, Zhu described. “For example, if a user has 100 samples, perhaps half from healthy people and half from those who are sick, those samples will appear in 100 columns.”
The OGU analysis package also includes a machine-learning component designed to answer biological questions. To ensure that it worked as designed, they tested it on a large data set, specifically the gut microbiomes from about 7,000 people in Finland, and asked whether their OGU method could predict the age of individuals from their microbiomes as accurately as could other methods, including state-of-the-art metagenomics tools that crunch taxonomy units [4]. “We found that all of the methods did their jobs, but the OGU method had the highest accuracy,” Liu said, noting that mean absolute error with OGU method was about 9.5 years, compared to 10–11 years with the top taxonomy-based method.
Liu’s group is now busy optimizing the OGU method to make alignments even more accurate, while also tailoring the database to the job at hand as a way to reduce computational time and costs. For instance, his group has begun studying the gut microbiome in people who have colorectal cancer, so they are engineering a database that only includes those gut microbes that have medical implications.
“Another research direction in my lab related to Woltka is that we have developed a new algorithm that allows you to quickly find the functional genes in the genomes,” he said. “In other words, we already know which genes are in genomes and we already have alignment, but this helps us associate alignments with genes, so we can not only know the structure, but also the functional capacities of the microbiome.”
With the OGA method and other analytic tools, a primary goal is to get a better understanding of microbiomes and their interaction with human health, Zhu said. “Our hope is that these analytic tools are beneficial to humanity, and ultimately help find better ways to treat and cure disease, and improve well-being and harmony in our world.”
References
- S. Siddiqui et al., “Alterations of the gut bacterial microbiota in rhesus macaques with SIV infection and on short- or long-term antiretroviral therapy,” Sci. Rep., vol. 10, no. 1, Dec. 2020, Art. no. 19056.
- F. Wu, Y.-Z. Liu, and B. Ling, “MTD: A unique pipeline for host and meta-transcriptome joint and integrative analyses of RNA-seq data,” Briefings Bioinf., vol. 23, no. 3, May 2022, Art. no. bbac111.
- Q. Zhu et al., “Phylogenomics of 10,575 genomes reveals evolutionary proximity between domains bacteria and archaea,” Nature Commun., vol. 10, no. 1, Dec. 2019, Art. no. 5477, doi: 10.1038/s41467-019-13443-4.
- Q. Zhu et al., “Phylogenomics of 10,575 genomes reveals evolutionary proximity between domains bacteria and archaea,” Nature Commun., vol. 10, no. 1, Dec. 2019, Art. no. e00167.