
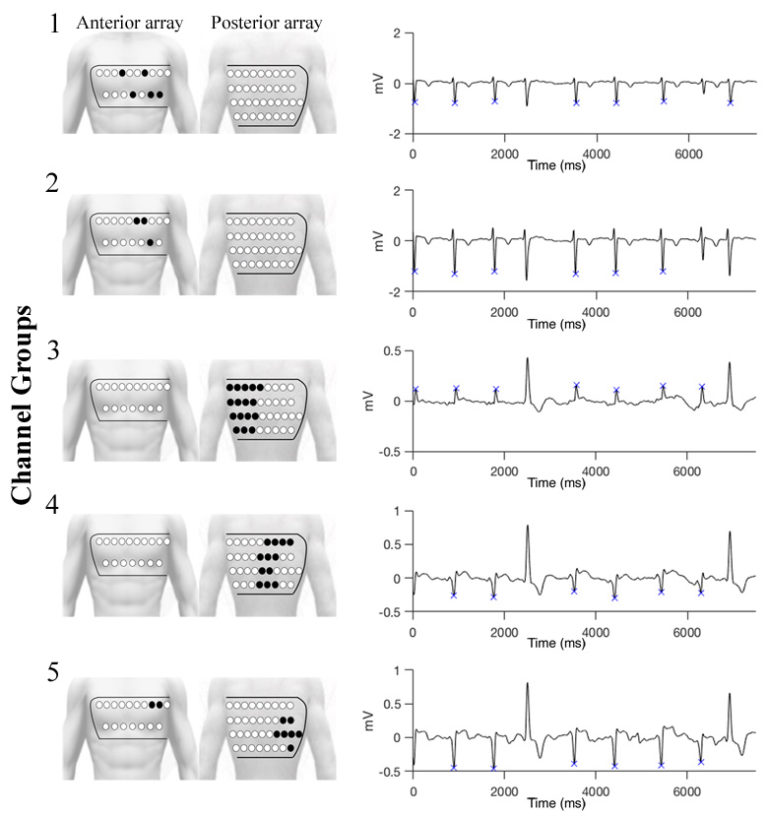
QRS Complex Detection and Measurement Algorithms for Multichannel ECGs in Cardiac Resynchronization Therapy Patients
https://www.embs.org/jtehm/wp-content/uploads/sites/17/2018/06/signal-groups-and-QRS-peaks.jpg
780
829
IEEE Journal of Translational Engineering in Health and Medicine (JTEHM)
//www.embs.org/jtehm/wp-content/uploads/sites/17/2022/06/ieee-jtehm-logo2x.png
Abstract We developed an automated approach for QRS complex detection and QRS duration (QRSd) measurement that can effectively analyze multichannel electrocardiograms (MECGs) acquired during abnormal conduction and pacing in…
read more